world.wikisort.org - USA
Cecilville (Karuk: íshirak[1]) is a small unincorporated community in Siskiyou County, California, United States. It is on the south fork of the Salmon River and was established when the area was settled by miners during the Gold Rush. The community was named for a prospector.[2] It was formerly in Klamath County before that county was dissolved and the part of that county, including Cecilville, was annexed by Siskiyou County.
Cecilville | |
|---|---|
Unincorporated community | |
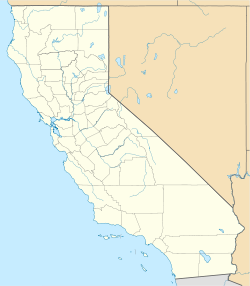 Cecilville Location within California  Cecilville Location within the United States | |
| Coordinates: 41°08′27″N 123°08′24″W | |
| Country | United States |
| State | California |
| County | Siskiyou |
Climate
| Climate data for Cecilville, California, 1991–2020 normals, extremes 1985–2003 | |||||||||||||
|---|---|---|---|---|---|---|---|---|---|---|---|---|---|
| Month | Jan | Feb | Mar | Apr | May | Jun | Jul | Aug | Sep | Oct | Nov | Dec | Year |
| Record high °F (°C) | 66 (19) |
77 (25) |
81 (27) |
92 (33) |
99 (37) |
106 (41) |
111 (44) |
110 (43) |
106 (41) |
98 (37) |
78 (26) |
62 (17) |
111 (44) |
| Mean maximum °F (°C) | 55.9 (13.3) |
64.4 (18.0) |
74.5 (23.6) |
85.4 (29.7) |
91.7 (33.2) |
99.7 (37.6) |
105.1 (40.6) |
104.1 (40.1) |
99.1 (37.3) |
88.5 (31.4) |
66.6 (19.2) |
54.8 (12.7) |
107.0 (41.7) |
| Average high °F (°C) | 44.6 (7.0) |
51.4 (10.8) |
58.6 (14.8) |
65.5 (18.6) |
75.4 (24.1) |
84.7 (29.3) |
95.9 (35.5) |
93.9 (34.4) |
89.3 (31.8) |
69.7 (20.9) |
53.7 (12.1) |
42.5 (5.8) |
68.8 (20.4) |
| Daily mean °F (°C) | 37.4 (3.0) |
41.2 (5.1) |
46.0 (7.8) |
50.7 (10.4) |
58.7 (14.8) |
65.5 (18.6) |
74.1 (23.4) |
72.1 (22.3) |
67.2 (19.6) |
53.5 (11.9) |
43.4 (6.3) |
36.5 (2.5) |
53.9 (12.1) |
| Average low °F (°C) | 30.1 (−1.1) |
30.9 (−0.6) |
33.4 (0.8) |
36.0 (2.2) |
42.1 (5.6) |
46.3 (7.9) |
52.3 (11.3) |
50.4 (10.2) |
45.0 (7.2) |
37.3 (2.9) |
33.1 (0.6) |
30.5 (−0.8) |
39.0 (3.9) |
| Mean minimum °F (°C) | 21.7 (−5.7) |
21.6 (−5.8) |
25.3 (−3.7) |
27.7 (−2.4) |
30.8 (−0.7) |
36.3 (2.4) |
42.8 (6.0) |
42.2 (5.7) |
36.7 (2.6) |
28.6 (−1.9) |
23.8 (−4.6) |
18.7 (−7.4) |
15.2 (−9.3) |
| Record low °F (°C) | 13 (−11) |
6 (−14) |
22 (−6) |
23 (−5) |
28 (−2) |
30 (−1) |
38 (3) |
38 (3) |
33 (1) |
22 (−6) |
16 (−9) |
2 (−17) |
2 (−17) |
| Average precipitation inches (mm) | 5.80 (147) |
4.74 (120) |
4.91 (125) |
2.58 (66) |
1.91 (49) |
0.99 (25) |
0.49 (12) |
0.43 (11) |
0.52 (13) |
2.30 (58) |
5.56 (141) |
7.59 (193) |
37.82 (960) |
| Average snowfall inches (cm) | 1.7 (4.3) |
3.5 (8.9) |
0.9 (2.3) |
0.8 (2.0) |
0.0 (0.0) |
0.0 (0.0) |
0.0 (0.0) |
0.0 (0.0) |
0.0 (0.0) |
0.0 (0.0) |
0.6 (1.5) |
3.4 (8.6) |
10.9 (27.6) |
| Average precipitation days (≥ 0.01 in) | 13.5 | 12.1 | 13.5 | 10.4 | 7.5 | 4.1 | 2.0 | 2.2 | 2.7 | 4.8 | 12.1 | 13.3 | 98.2 |
| Average snowy days (≥ 0.1 in) | 1.2 | 1.0 | 0.5 | 0.3 | 0.0 | 0.0 | 0.0 | 0.0 | 0.0 | 0.0 | 0.3 | 1.3 | 4.6 |
| Source 1: NOAA (aver precip/precip days, average snow/snow days 1981-2010)[3][4] | |||||||||||||
| Source 2: WRCC (mean maxima and minima 1985-2003)[5] | |||||||||||||
References
- "Karuk Dictionary and Texts". Retrieved 2012-07-10.
- Hillfinger, Charles (Jan 20, 1984). "The party's not over in tiny Cecilville, Calif". Sarasota Herald-Tribune. pp. 6C. Retrieved 9 January 2016.
- "U.S. Climate Normals Quick Access - Station: Cecilville, CA (1991-2020)". National Oceanic and Atmospheric Administration. Retrieved October 30, 2022.
- "U.S. Climate Normals Quick Access - Station: Cecilville, CA (1981-2010)". National Oceanic and Atmospheric Administration. Retrieved October 30, 2022.
- "Period of Record Monthly Climate Summary". Western Regional Climate Center. Retrieved October 30, 2022.
Municipalities and communities of Siskiyou County, California, United States | ||
|---|---|---|
County seat: Yreka | ||
| Cities | 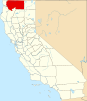 | |
| CDPs |
| |
| Unincorporated communities |
| |
| Indian reservation |
| |
| Ghost towns |
| |
| Footnotes | ‡This populated place also has portions in an adjacent county or counties | |
| ||
| Authority control |
|---|
This Siskiyou County, California-related article is a stub. You can help Wikipedia by expanding it. |
Текст в блоке "Читать" взят с сайта "Википедия" и доступен по лицензии Creative Commons Attribution-ShareAlike; в отдельных случаях могут действовать дополнительные условия.
Другой контент может иметь иную лицензию. Перед использованием материалов сайта WikiSort.org внимательно изучите правила лицензирования конкретных элементов наполнения сайта.
Другой контент может иметь иную лицензию. Перед использованием материалов сайта WikiSort.org внимательно изучите правила лицензирования конкретных элементов наполнения сайта.
2019-2026
WikiSort.org - проект по пересортировке и дополнению контента Википедии
WikiSort.org - проект по пересортировке и дополнению контента Википедии