world.wikisort.org - USA
California's 5th congressional district is a U.S. congressional district in California. Mike Thompson, a Democrat, has represented the district since January 2013.
| California's 5th congressional district | |||
|---|---|---|---|
Interactive map of district boundaries since 2023 (Used in the 2022 elections) | |||
| Representative |
| ||
| Population (2021) | 710,312 | ||
| Median household income | $88,514[1] | ||
| Ethnicity |
| ||
| Cook PVI | D+22[2] | ||


Currently, the 5th district encompasses much of California's Wine Country and portions of the East Bay. It consists of Napa County plus portions of Contra Costa, Lake, Solano, and Sonoma counties. Cities in the district include Cotati, Rohnert Park, Santa Rosa, Sonoma, Napa, American Canyon, Vallejo, Benicia, Hercules, and most of Martinez.[3]
Starting in the 2022 midterm elections, the district is located in the northern San Joaquin Valley and central Sierra Nevada. It includes Amador, Calaveras, Tuolumne, and Mariposa counties, most of Stanislaus County, and parts of El Dorado and Fresno counties. The new 5th district is strongly Republican and includes the majority of Modesto, much of northern Fresno, the northern half of Turlock, and Yosemite and Kings Canyon national parks.[4]
Competitiveness
John Kerry won the district in 2004 with 61.1% of the vote. The district swung more into the Democratic column in 2008 when Barack Obama won 69.62% of the vote while John McCain received 28.40%.
Election results from recent statewide races
| Year | U.S. President | U.S. Senator (Class 1) | U.S. Senator (Class 3) | Governor |
|---|---|---|---|---|
| 1992 | Clinton (D) 50.9 - 31.1% | Feinstein (D) 59.8 - 32.6% | Boxer (D) 55.2 - 35.3% | — |
| 1994 | — | [data unknown/missing] | — | Brown (D) 48.6 - 47.2% |
| 1996 | Clinton (D) 57.1 - 33.8% | — | — | — |
| 1998 | — | — | [data unknown/missing] | [data unknown/missing] |
| 2000 | Gore (D) 57.1 - 37.0%[5] | Feinstein (D) 61.6 - 31.1%[6] | — | — |
| 2002 | — | — | — | Davis (D) 50.4 - 35.3%[7] |
| 2003 | — | — | — | Recall: |
| Schwarzenegger (R) 43.1 - 35.4% | ||||
| 2004 | Kerry (D) 61.1 - 37.9%[10] | — | Boxer (D) 68.3 - 27.5%[11] | — |
| 2006 | — | Feinstein (D) 66.7 - 27.1%[12] | — | Schwarzenegger (R) 49.6 - 43.8% |
| 2008 | Obama (D) 69.5 - 28.4%[13] | — | — | — |
| 2010 | — | — | Boxer (D) 62.2 - 33.3%[14] | Brown (D) 68.1 - 27.1%[15] |
| 2012 | Obama (D) 69.7 - 27.4%[16] | Feinstein (D) 72.5 - 27.5%[17] | — | — |
| 2014 | — | — | — | Brown (D) 72.6 - 27.4%[18] |
| 2016 | Clinton (D) 69.4 – 22.2%[19] | — | Harris (D) 73.0 - 27%[20]| | — |
| 2018 | — | Feinstein (D) 56.3 - 43.7%[21] | — | Newsom (D) 70.0 - 30.0%[22] |
| 2020 | Biden (D) 72.4 – 25.3%[23] | — | — | — |
| 2021 | — | — | — | Recall: |
Composition
| # | County | Seat | Population |
|---|---|---|---|
| 5 | Amador | Jackson | 41,259 |
| 9 | Calaveras | San Andreas | 46,221 |
| 43 | Mariposa | Mariposa | 17,147 |
| 109 | Tuolumne | Sonora | 55,810 |
As of 2023, California's 4th congressional district is located in the Sierra Nevada region's Gold Country. It encompasses Amador, Calaveras, Mariposa, and Tuolumne Counties, as well as most of Madera County and parts of El Dorado, Fresno, and Stanislaus Counties.
El Dorado County is split between this district and the 3rd district. They are partitioned by Scott Creek, Perry Creek, Perry Creek Rd, Rocky Bar Rd, Grizzly Flat Rd, Happy Valley Rd, Canon Creek, E16 Highway, Pleasant Valley Rd, Cedar Ravine Rd, Woodland Dr, Weber Creek, Highway 50, Chili Bar Reservoir, South Fork American River, Marshall Rd, Hastings Creek, Highway 49, Pilot Creek, North Fork American River, and the Folsom Lake State Recreation Area. The 5th district takes in the cities of El Dorado Hills and Placerville, and the census-designated place Diamond Springs.
Fresno County is split between this district and both the 20th district and 21st district. They are partitioned on the northern border by Highway 245, Dunlap Rd, Mill Creek, Millwood, Mill, Mill Flat Creek, Kings River, Sycamore Springs Rd, Bobs Flat Rd, Powerhouse Rd, Wilson Rd, and Smalley Rd. They are partitioned on the southern border by N Willow Ave, E Herndon Ave, E Bullard Ave, N Blackstone Ave, W Shaw Ave, Burlington Northern Santa Fe, N Marks Ave, N Hazel Ave, W Figarden Dr, and W Herndon Ave. The 5th district takes in the north side of the city of Fresno, and Kings Canyon National Park and Sierra National Forest.
Madera County is split between this district and the 13th district. They are partitioned by Road 35, Road 36, Road 38, Madera Equalization Reservoir, River Rd, Avenue 21, Road 23, Avenue 27, Road 22 1/2, and Berenda Slough. The 5th district takes in the census-designated places Yosemite Lakes Park and Oakhurst.
Stanislaus County is split between this district and both the 9th district and 13th district. They are partitioned on the northern border by Lon Dale Rd, Highway J9, Highway J14, River Rock Rd, Lesnini Creek, Sonora Rd, and Stanislaus River. They are partitioned on the southern border by S Golden State Blvd, Highway J14, Union Pacific, Highway 99, N Golden State Blvd, Faith Home Rd, Rohde Rd, Moore Rd, Tuolumne River, Burlington Northern Santa Fe, Lateral No 2 Park, Viola St, Roble Ave, N Conejo Ave, N Carpenter Rd, Kansas Ave, Morse Rd, and Stanislaus River. The 5th district takes in the northern halves of the cities of Modesto and Turlock, the cities of Riverbank, Oakdale, and Waterford, as well as the census-designated places Salida, Hughson, and Keyes.
Cities & CDP with 10,000 or more people
- Modesto - 218,464
- Turlock - 67,953
- Oakdale - 20,364
- Salida - 13,886
- Placerville - 10,747
2,500-10,000 people
- Ione - 8,568
- Hughson - 6,425
- Keyes - 5,809
- Rancho Calaveras - 5,325
- Sonora - 5,226
- Jackson - 4,840
- Phoenix Lake - 4,264
- Valley Springs - 3,890
- Angels Camp - 3,667
- Mono Vista - 3,646
- Copperopolis - 3,400
- Jamestown - 3,379
- Arnold - 3,288
- San Andreas - 2,783
- Sutter Creek - 2,622
- Pine Mountain Lake - 2,604
- Columbia - 2,577
List of members representing the district
| Member | Party | Years | Cong ress(es) |
Electoral history | Counties |
|---|---|---|---|---|---|
| District created March 4, 1885 | |||||
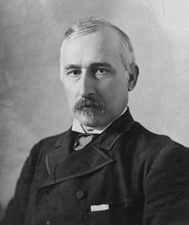 Charles N. Felton |
Republican | March 4, 1885 – March 3, 1889 |
49th 50th |
Elected in 1884. Re-elected in 1886. Retired. |
1885–1893 San Francisco, San Mateo, Santa Clara, Santa Cruz |
 Thomas J. Clunie |
Democratic | March 4, 1889 – March 3, 1891 |
51st | Elected in 1888. Retired. | |
 Eugene F. Loud |
Republican | March 4, 1891 – March 3, 1903 |
52nd 53rd 54th 55th 56th 57th |
Elected in 1890. Re-elected in 1892. Re-elected in 1894. Re-elected in 1896. Re-elected in 1898. Re-elected in 1900. Lost re-election. | |
| 1893–1913 San Francisco, San Mateo, Santa Clara | |||||
 William J. Wynn |
Democratic-Union Labor | March 4, 1903 – March 3, 1905 |
58th | Elected in 1902. Lost re-election. | |
 Everis A. Hayes |
Republican | March 4, 1905 – March 3, 1913 |
59th 60th 61st 62nd |
Elected in 1904. Re-elected in 1906. Re-elected in 1908. Re-elected in 1910. Redistricted to the 8th district. | |
 John I. Nolan |
Republican | March 4, 1913 – November 18, 1922 |
63rd 64th 65th 66th 67th |
Elected in 1912. Re-elected in 1914. Re-elected in 1916. Re-elected in 1918. Re-elected in 1920. Re-elected in 1922. Died. |
1913–1967 San Francisco |
| Vacant | November 18, 1922 – January 23, 1923 |
67th | |||
 Mae Nolan |
Republican | January 23, 1923 – March 3, 1925 |
67th 68th |
Elected only to finish her husband's term. Retired. | |
 Lawrence J. Flaherty |
Republican | March 4, 1925 – June 13, 1926 |
69th | Elected in 1924. Died. | |
| Vacant | June 13, 1926 – August 31, 1926 | ||||
 Richard J. Welch |
Republican | August 31, 1926 – September 10, 1949 |
69th 70th 71st 72nd 73rd 74th 75th 76th 77th 78th 79th 80th 81st |
Elected to finish Flaherty's term. Re-elected in 1928. Re-elected in 1930. Re-elected in 1932. Re-elected in 1934. Re-elected in 1936. Re-elected in 1938. Re-elected in 1940. Re-elected in 1942. Re-elected in 1944. Re-elected in 1946. Re-elected in 1948. Died. | |
| Vacant | September 10, 1949 – November 8, 1949 |
81st | |||
 John F. Shelley |
Democratic | November 8, 1949 – January 7, 1964 |
81st 82nd 83rd 84th 85th 86th 87th 88th |
Elected to finish Welch's term. Re-elected in 1950. Re-elected in 1952. Re-elected in 1954. Re-elected in 1956. Re-elected in 1958. Re-elected in 1960. Re-elected in 1962. Resigned to become Mayor of San Francisco. | |
| Vacant | January 7, 1964 – February 18, 1964 |
88th | |||
 Phillip Burton |
Democratic | February 18, 1964 – January 3, 1975 |
88th 89th 90th 91st 92nd 93rd |
Elected to finish Shelley's term. Re-elected later in 1964. Re-elected in 1966. Re-elected in 1968. Re-elected in 1970. Re-elected in 1972. Redistricted to the 6th district. | |
| Eastern San Francisco | |||||
 John Burton |
Democratic | January 3, 1975 – January 3, 1983 |
94th 95th 96th 97th |
Redistricted from the 6th district and re-elected in 1974. Re-elected in 1976. Re-elected in 1978. Re-elected in 1980. Retired. |
1975–1983 Marin, northwestern San Francisco |
Phillip Burton |
Democratic | January 3, 1983 – April 10, 1983 |
98th | Redistricted from the 6th district and re-elected in 1982. Died. |
1983–1993 Western San Francisco |
| Vacant | April 10, 1983 – June 21, 1983 |
||||
 Sala Burton |
Democratic | June 21, 1983 – February 1, 1987 |
98th 99th 100th |
Elected to finish her husband's term. Re-elected in 1984. Re-elected in 1986. Died. | |
| Vacant | February 1, 1987 – June 2, 1987 |
100th | |||
 Nancy Pelosi |
Democratic | June 2, 1987 – January 3, 1993 |
100th 101st 102nd |
Elected to finish Burton's term. Re-elected in 1988. Re-elected in 1990. Redistricted to the 8th district. | |
 Bob Matsui |
Democratic | January 3, 1993 – January 1, 2005 |
103rd 104th 105th 106th 107th 108th |
Redistricted from the 3rd district and re-elected in 1992. Re-elected in 1994. Re-elected in 1996. Re-elected in 1998. Re-elected in 2000. Re-elected in 2002. Re-elected in 2004, but died before his term began. |
1993–2003 Sacramento (Sacramento city) |
| 2003–2013 Sacramento (Sacramento city)  | |||||
| Vacant | January 1, 2005 – March 8, 2005 |
108th 109th | |||
 Doris Matsui |
Democratic | March 8, 2005 – January 3, 2013 |
109th 110th 111th 112th |
Elected to finish her husband's term. Re-elected in 2006. Re-elected in 2008. Re-elected in 2010. Redistricted to the 6th district. | |
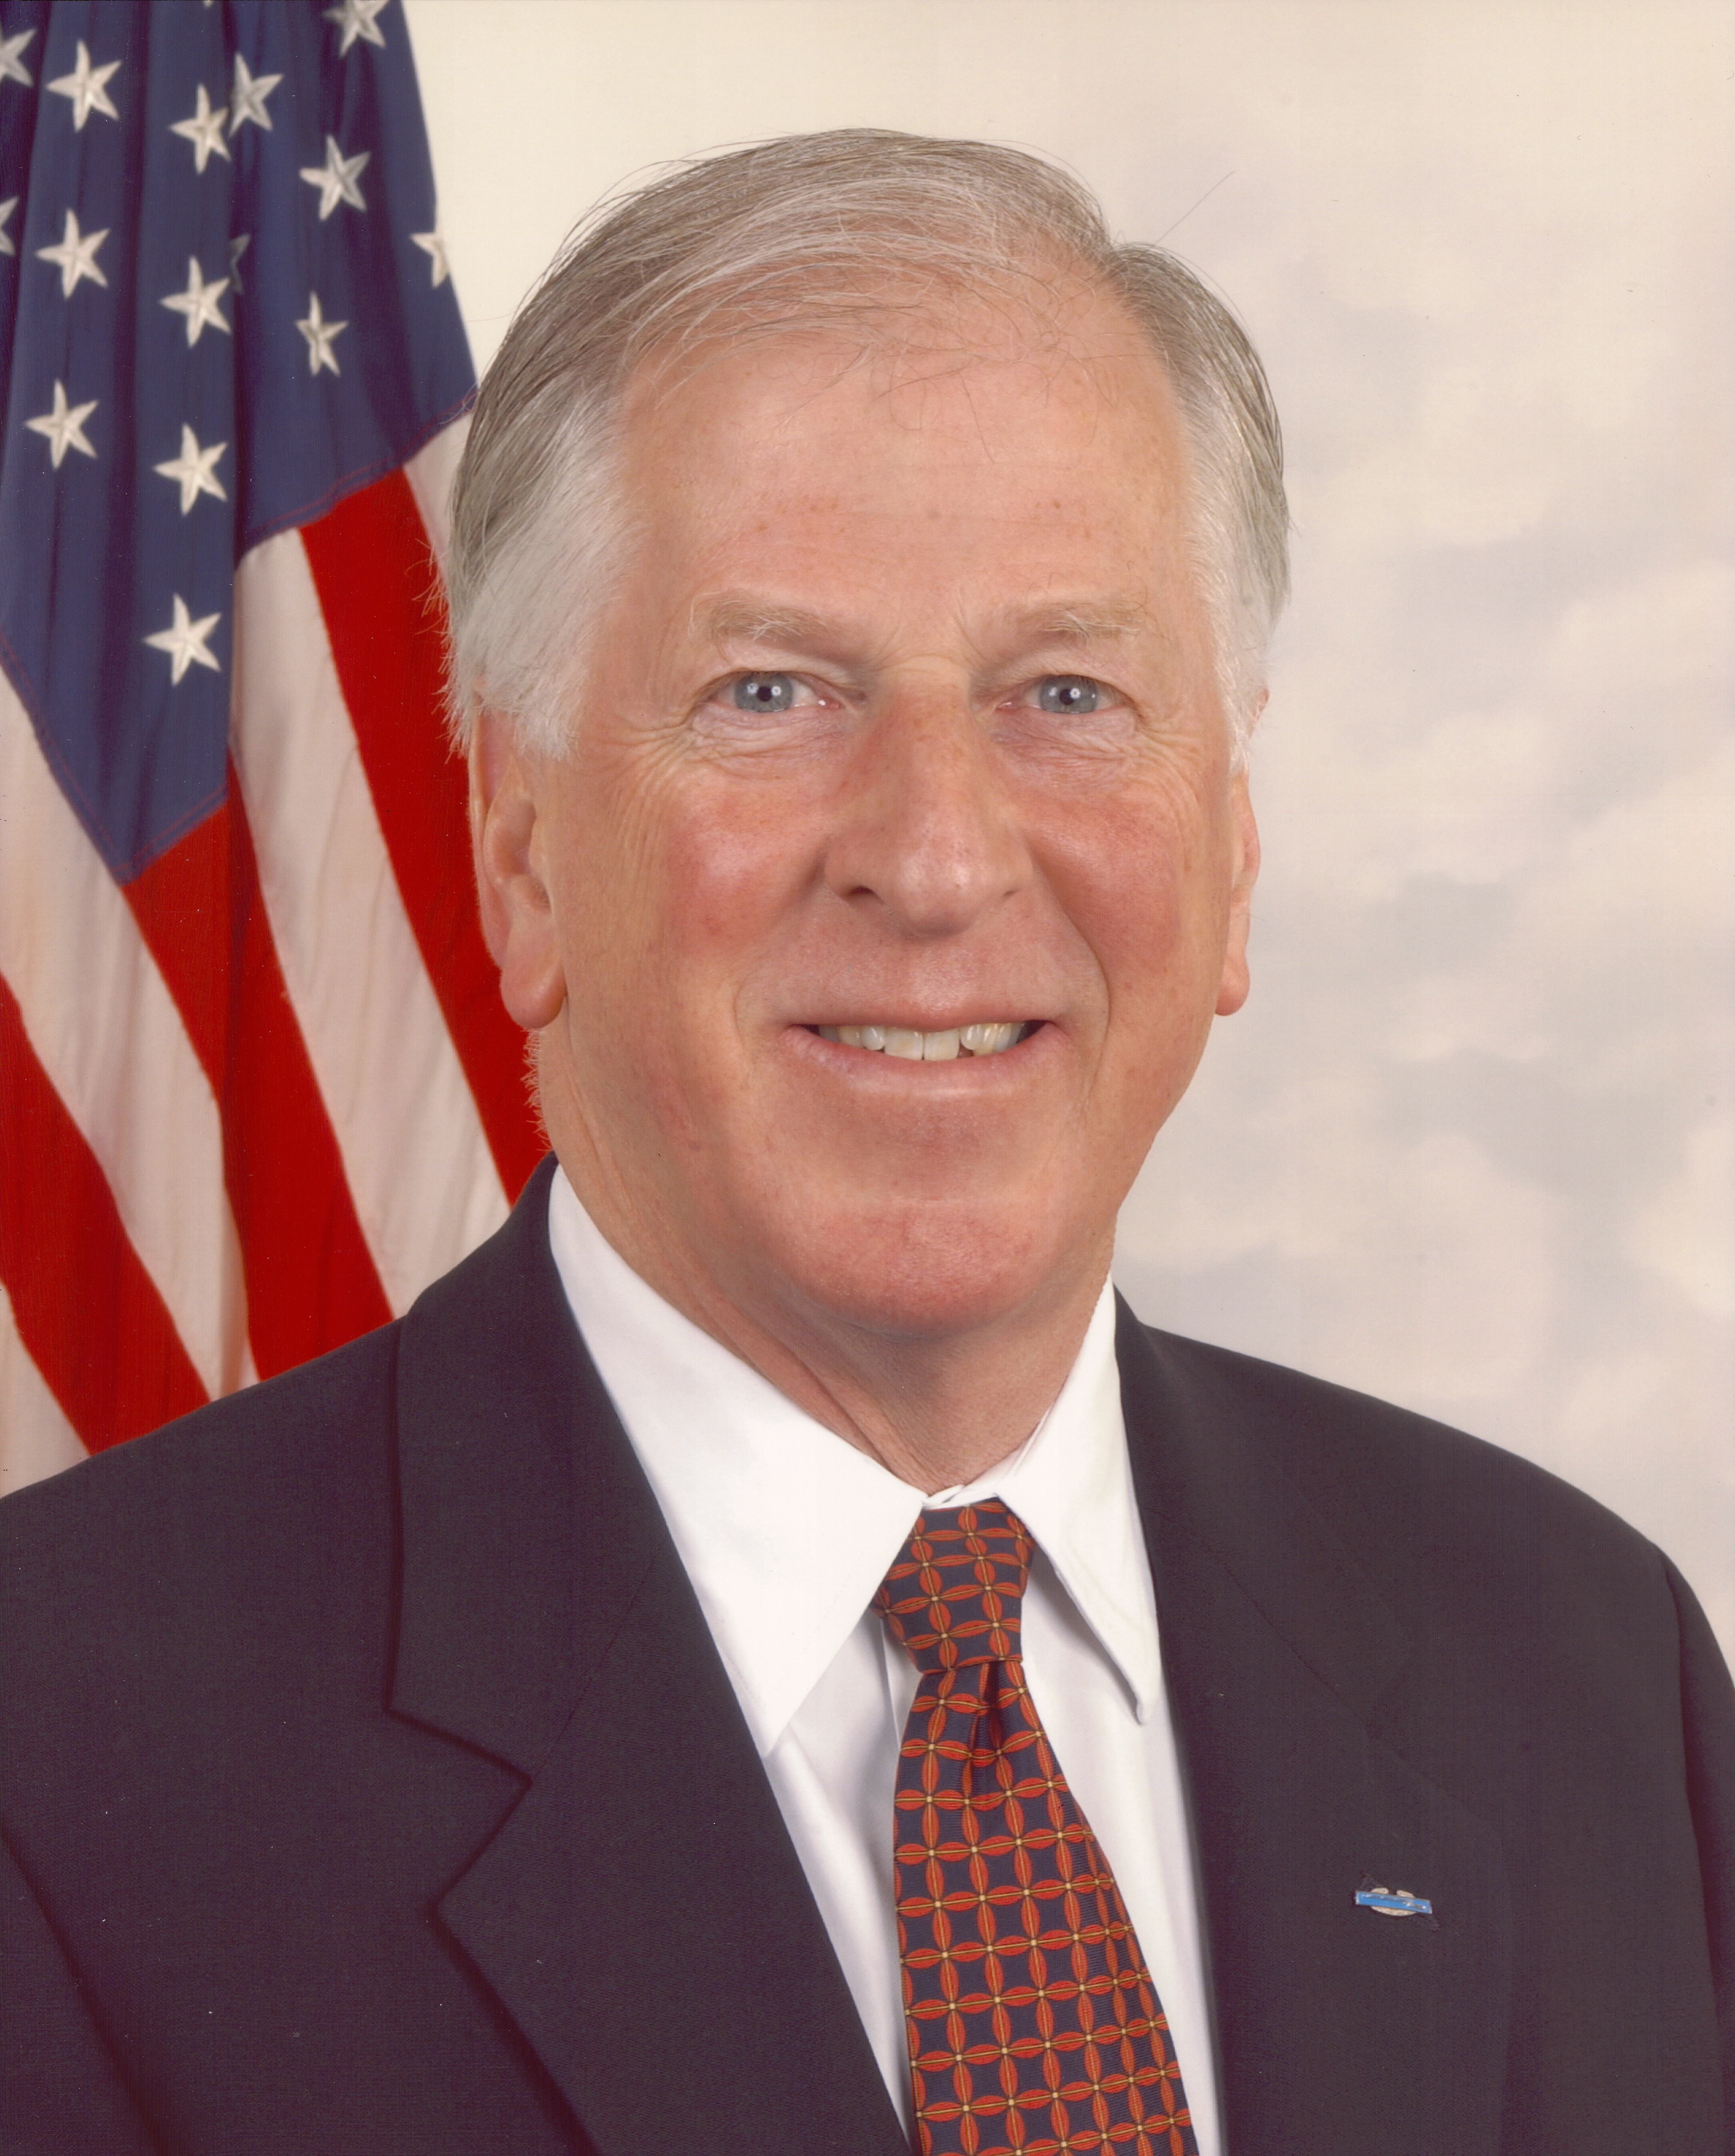 Mike Thompson |
Democratic | January 3, 2013 – present |
113th 114th 115th 116th 117th |
Redistricted from the 1st district and re-elected in 2012. Re-elected in 2014. Re-elected in 2016. Re-elected in 2018. Re-elected in 2020. Redistricted to the 4th district. |
2013–present North Bay area including Napa, Santa Rosa, and Vallejo  |
 Tom McClintock |
Republican | January 3, 2023 – |
Redistricted from the 4th district and re-elected in 2022. | ||
Complete election results
|
1884 • 1886 • 1888 • 1890 • 1892 • 1894 • 1896 • 1898 • 1900 • 1902 • 1904 • 1906 • 1908 • 1910 • 1912 • 1914 • 1916 • 1918 • 1920 • 1922 • 1923 (Special) • 1924 • 1926 (Special) • 1926 • 1928 • 1930 • 1932 • 1934 • 1936 • 1927 (Special) • 1938 • 1940 • 1942 • 1944 • 1946 • 1948 • 1949 (Special) • 1950 • 1952 • 1954 • 1956 • 1958 • 1960 • 1962 • 1964 • 1966 • 1968 • 1970 • 1972 • 1974 • 1976 • 1978 • 1980 • 1982 • 1983 (Special) • 1984 • 1986 • 1987 (Special) • 1988 • 1990 • 1992 • 1994 • 1996 • 1998 • 2000 • 2002 • 2004 • 2005 (Special) • 2006 • 2008 • 2010 • 2012 • 2014 • 2016 • 2018 • 2020 |
1884
| Party | Candidate | Votes | % | |||
|---|---|---|---|---|---|---|
| Republican | Charles N. Felton | 17,014 | 51.7 | |||
| Democratic | Frank J. Sullivan | 15,676 | 47.6 | |||
| Prohibition | William Crowhurst | 232 | 0.7 | |||
| Total votes | 32,922 | 100.0 | ||||
| Turnout | ||||||
| Republican gain from Democratic | ||||||
1886
| Party | Candidate | Votes | % | |
|---|---|---|---|---|
| Republican | Charles N. Felton (Incumbent) | 16,328 | 48.8 | |
| Democratic | Frank J. Sullivan | 16,209 | 48.4 | |
| Independent | Albert E. Redstone | 470 | 1.4 | |
| Prohibition | C. Henderson | 460 | 1.4 | |
| Total votes | 33,467 | 100.0 | ||
| Turnout | ||||
| Republican hold | ||||
1888
| Party | Candidate | Votes | % | |||
|---|---|---|---|---|---|---|
| Democratic | Thomas J. Clunie | 20,276 | 49.3 | |||
| Republican | Timothy Guy Phelps | 20,225 | 49.2 | |||
| Independent | Henry French | 613 | 1.5 | |||
| Total votes | 41,114 | 100.0 | ||||
| Turnout | ||||||
| Democratic gain from Republican | ||||||
1890
| Party | Candidate | Votes | % | |||
|---|---|---|---|---|---|---|
| Republican | Eugene F. Loud | 22,871 | 52.8 | |||
| Democratic | Thomas J. Clunie (Incumbent) | 19,899 | 45.9 | |||
| Socialist | E. F. Howe | 574 | 1.3 | |||
| Total votes | 43,344 | 100.0 | ||||
| Turnout | ||||||
| Republican gain from Democratic | ||||||
1892
| Party | Candidate | Votes | % | |
|---|---|---|---|---|
| Republican | Eugene F. Loud (Incumbent) | 14,660 | 46.4 | |
| Democratic | J. W. Ryland | 13,694 | 43.3 | |
| Populist | Jonas J. Morrison | 2,484 | 7.9 | |
| Prohibition | William Kelly | 771 | 2.4 | |
| Total votes | 31,609 | 100.0 | ||
| Turnout | ||||
| Republican hold | ||||
1894
| Party | Candidate | Votes | % | |
|---|---|---|---|---|
| Republican | Eugene F. Loud (Incumbent) | 13,379 | 36.8 | |
| Democratic | Joseph P. Kelly | 8,384 | 23.0 | |
| Populist | James T. Rogers | 7,820 | 21.5 | |
| Prohibition | James Denman | 6,811 | 18.7 | |
| Total votes | 36,394 | 100.0 | ||
| Turnout | ||||
| Democratic hold | ||||
1896
| Party | Candidate | Votes | % | |
|---|---|---|---|---|
| Republican | Eugene F. Loud (Incumbent) | 19,351 | 48.6 | |
| Democratic | Joseph P. Kelly | 10,494 | 26.3 | |
| Populist | A. B. Kinne | 8,825 | 22.2 | |
| Socialist Labor | Henry Daniels | 757 | 1.9 | |
| Prohibition | T. H. Lawson | 404 | 1.0 | |
| Total votes | 39,831 | 100.0 | ||
| Turnout | ||||
| Republican hold | ||||
1898
| Party | Candidate | Votes | % | |
|---|---|---|---|---|
| Republican | Eugene F. Loud (Incumbent) | 20,254 | 51.8 | |
| Democratic | William Craig | 17,352 | 44.3 | |
| Socialist Labor | E. T. Kingsley | 1,532 | 3.9 | |
| Total votes | 39,138 | 100.0 | ||
| Turnout | ||||
| Republican hold | ||||
1900
| Party | Candidate | Votes | % | |
|---|---|---|---|---|
| Republican | Eugene F. Loud (Incumbent) | 23,443 | 55.7 | |
| Democratic | J. H. Henry | 17,365 | 41.3 | |
| Socialist | C. H. King | 942 | 2.2 | |
| Prohibition | Fred E. Caton | 322 | 0.8 | |
| Total votes | 42,072 | 100.0 | ||
| Turnout | ||||
| Republican hold | ||||
1902
| Party | Candidate | Votes | % | |||
|---|---|---|---|---|---|---|
| Democratic | William J. Wynn | 22,712 | 56.5 | |||
| Republican | Eugene F. Loud (Incumbent) | 16,577 | 41.2 | |||
| Socialist | Joseph Lawrence | 620 | 1.5 | |||
| Prohibition | Fred E. Caton | 301 | 0.8 | |||
| Total votes | 40,210 | 100.0 | ||||
| Turnout | ||||||
| Democratic gain from Republican | ||||||
1904
| Party | Candidate | Votes | % | |||
|---|---|---|---|---|---|---|
| Republican | Everis A. Hayes | 23,701 | 52.3 | |||
| Democratic | William J. Wynn (Incumbent) | 18,025 | 39.7 | |||
| Union Labor | F. R. Whitney | 2,263 | 5.0 | |||
| Socialist | Charles J. Williams | 916 | 2.0 | |||
| Prohibition | George B. Pratt | 445 | 1.0 | |||
| Total votes | 45,350 | 100.0 | ||||
| Turnout | ||||||
| Republican gain from Democratic | ||||||
1906
| Party | Candidate | Votes | % | |
|---|---|---|---|---|
| Republican | Everis A. Hayes (Incumbent) | 22,530 | 53.4 | |
| Democratic | Hiram G. Davis | 17,295 | 41.0 | |
| Socialist | Joseph Lawrence | 2,343 | 5.6 | |
| Total votes | 42,168 | 100.0 | ||
| Turnout | ||||
| Republican hold | ||||
1908
| Party | Candidate | Votes | % | |
|---|---|---|---|---|
| Republican | Everis A. Hayes (Incumbent) | 28,127 | 49.1 | |
| Democratic | George A. Tracy | 24,531 | 42.8 | |
| Socialist | E. H. Misner | 3,640 | 6.3 | |
| Prohibition | Walter E. Vail | 1,045 | 1.8 | |
| Total votes | 57,343 | 100.0 | ||
| Turnout | ||||
| Republican hold | ||||
1910
| Party | Candidate | Votes | % | |
|---|---|---|---|---|
| Republican | Everis A. Hayes (Incumbent) | 33,265 | 59.4 | |
| Democratic | Thomas E. Hayden | 15,345 | 27.4 | |
| Socialist | E. L. Reguin | 7,052 | 12.6 | |
| Prohibition | T. E. Caton | 359 | 0.6 | |
| Total votes | 56,021 | 100.0 | ||
| Turnout | ||||
| Republican hold | ||||
1912
| Party | Candidate | Votes | % | ||
|---|---|---|---|---|---|
| Republican | John I. Nolan | 27,902 | 52.3 | ||
| Socialist | Stephen V. Costello | 18,516 | 34.7 | ||
| Prohibition | E. L. Requin | 6,962 | 13.0 | ||
| Total votes | 53,380 | 100.0 | |||
| Turnout | |||||
| Republican win (new seat) | |||||
1914
| Party | Candidate | Votes | % | |
|---|---|---|---|---|
| Republican | John I. Nolan (Incumbent) | 53,875 | 83.3 | |
| Socialist | Mads Peter Christensen | 7,366 | 11.4 | |
| Prohibition | Frederick Head | 3,410 | 5.3 | |
| Total votes | 64,651 | 100.0 | ||
| Turnout | ||||
| Republican hold | ||||
1916
| Party | Candidate | Votes | % | |
|---|---|---|---|---|
| Republican | John I. Nolan (Incumbent) | 59,333 | 84.7 | |
| Socialist | Charles A. Preston | 6,708 | 9.6 | |
| Prohibition | Frederick Head | 4,046 | 5.8 | |
| Total votes | 70,087 | 100.0 | ||
| Turnout | ||||
| Republican hold | ||||
1918
| Party | Candidate | Votes | % | |
|---|---|---|---|---|
| Republican | John I. Nolan (Incumbent) | 40,375 | 87 | |
| Socialist | Thomas F. Feeley | 6,032 | 13 | |
| Total votes | 46,407 | 100.0 | ||
| Turnout | ||||
| Republican hold | ||||
1920
| Party | Candidate | Votes | % | |
|---|---|---|---|---|
| Republican | John I. Nolan (Incumbent) | 50,274 | 81.8 | |
| Socialist | Hugo Ernst | 10,952 | 18.2 | |
| Total votes | 61,226 | 100.0 | ||
| Turnout | ||||
| Republican hold | ||||
1922
| Party | Candidate | Votes | % | |
|---|---|---|---|---|
| Republican | John I. Nolan (Incumbent) | 49,414 | 100.0 | |
| Turnout | ||||
| Republican hold | ||||
1923 (Special)
Republican Mae Nolan won the special election to replace her husband John I. Nolan, who won re-election but died before the 68th Congress convened. Data for this special election is not available.[27]
1924
| Party | Candidate | Votes | % | |
|---|---|---|---|---|
| Republican | Lawrence J. Flaherty | 38,893 | 72.6 | |
| Socialist | Isabel C. King | 12,175 | 27.4 | |
| Total votes | 51,068 | 100.0 | ||
| Turnout | ||||
| Republican hold | ||||
1926 (Special)
Republican Richard J. Welch won the special election to replace fellow Republican Lawrence J. Flaherty, who died in office. Data for this special election is not available.[29]
1926
| Party | Candidate | Votes | % | |
|---|---|---|---|---|
| Republican | Richard J. Welch (Incumbent) | 47,694 | 100.0 | |
| Turnout | ||||
| Republican hold | ||||
1928
| Party | Candidate | Votes | % | |
|---|---|---|---|---|
| Republican | Richard J. Welch (Incumbent) | 51,708 | 100.0 | |
| Turnout | ||||
| Republican hold | ||||
1930
| Party | Candidate | Votes | % | |
|---|---|---|---|---|
| Republican | Richard J. Welch (Incumbent) | 59,853 | 100.0 | |
| Turnout | ||||
| Republican hold | ||||
1932
| Party | Candidate | Votes | % | |
|---|---|---|---|---|
| Republican | Richard J. Welch (Incumbent) | 67,349 | 100.0 | |
| Turnout | ||||
| Republican hold | ||||
1934
| Party | Candidate | Votes | % | |
|---|---|---|---|---|
| Republican | Richard J. Welch (Incumbent) | 89,751 | 93.8 | |
| Communist | Alexander Noral | 5,933 | 6.2 | |
| Total votes | 95,684 | 100.0 | ||
| Turnout | ||||
| Republican hold | ||||
1936
| Party | Candidate | Votes | % | |
|---|---|---|---|---|
| Republican | Richard J. Welch (Incumbent) | 82,910 | 94.8 | |
| Communist | Lawrence Ross | 4,545 | 5.2 | |
| Total votes | 87,455 | 100.0 | ||
| Turnout | ||||
| Republican hold | ||||
1938
| Party | Candidate | Votes | % | |
|---|---|---|---|---|
| Republican | Richard J. Welch (Incumbent) | 91,868 | 100.0 | |
| Turnout | ||||
| Republican hold | ||||
1940
| Party | Candidate | Votes | % | |
|---|---|---|---|---|
| Republican | Richard J. Welch (Incumbent) | 119,122 | 95.8 | |
| Communist | Walter R. Lambert | 5,232 | 4.2 | |
| Total votes | 124,354 | 100.0 | ||
| Turnout | ||||
| Republican hold | ||||
1942
| Party | Candidate | Votes | % | |
|---|---|---|---|---|
| Republican | Richard J. Welch (Incumbent) | 85,747 | 92.7 | |
| Communist | Walter R. Lambert | 6,749 | 7.3 | |
| Total votes | 92,496 | 100.0 | ||
| Turnout | ||||
| Republican hold | ||||
1944
| Party | Candidate | Votes | % | |
|---|---|---|---|---|
| Republican | Richard J. Welch (Incumbent) | 112,151 | 100.0 | |
| Turnout | ||||
| Republican hold | ||||
1946
| Party | Candidate | Votes | % | |
|---|---|---|---|---|
| Republican | Richard J. Welch (Incumbent) | 94,293 | 100.0 | |
| Turnout | ||||
| Republican hold | ||||
1948
| Party | Candidate | Votes | % | |
|---|---|---|---|---|
| Republican | Richard J. Welch (Incumbent) | 116,347 | 100.0 | |
| Turnout | ||||
| Republican hold | ||||
1949 (Special)
Democrat John F. Shelley won the special election to replace Republican Richard J. Welch, who died in office. Data for this special election is not available.[42]
1950
| Party | Candidate | Votes | % | |
|---|---|---|---|---|
| Democratic | John F. Shelley (Incumbent) | 117,888 | 100.0 | |
| Turnout | ||||
| Democratic hold | ||||
1952
| Party | Candidate | Votes | % | |
|---|---|---|---|---|
| Democratic | John F. Shelley (Incumbent) | 107,542 | 100.0 | |
| Turnout | ||||
| Democratic hold | ||||
1954
| Party | Candidate | Votes | % | |
|---|---|---|---|---|
| Democratic | John F. Shelley (Incumbent) | 86,428 | 100.0 | |
| Turnout | ||||
| Democratic hold | ||||
1956
| Party | Candidate | Votes | % | |
|---|---|---|---|---|
| Democratic | John F. Shelley (Incumbent) | 104,358 | 100.0 | |
| Turnout | ||||
| Democratic hold | ||||
1958
| Party | Candidate | Votes | % | |
|---|---|---|---|---|
| Democratic | John F. Shelley (Incumbent) | 99,171 | 100.0 | |
| Turnout | ||||
| Democratic hold | ||||
1960
| Party | Candidate | Votes | % | |
|---|---|---|---|---|
| Democratic | John F. Shelley (Incumbent) | 104,507 | 83.7 | |
| Republican | Vick Verreos | 20,305 | 16.3 | |
| Total votes | 124,812 | 100.0 | ||
| Turnout | ||||
| Democratic hold | ||||
1962
| Party | Candidate | Votes | % | |
|---|---|---|---|---|
| Democratic | John F. Shelley (Incumbent) | 64,493 | 80.4 | |
| Republican | Roland S. Charles | 15,670 | 19.6 | |
| Total votes | 80,163 | 100.0 | ||
| Turnout | ||||
| Democratic hold | ||||
1964
| Party | Candidate | Votes | % | |
|---|---|---|---|---|
| Democratic | Phillip Burton (Incumbent) | 71,638 | 100.0 | |
| Turnout | ||||
| Democratic hold | ||||
1966
| Party | Candidate | Votes | % | |
|---|---|---|---|---|
| Democratic | Phillip Burton (Incumbent) | 56,476 | 71.3 | |
| Republican | Terry R. Macken | 22,778 | 28.7 | |
| Total votes | 79,254 | 100.0 | ||
| Turnout | ||||
| Democratic hold | ||||
1968
| Party | Candidate | Votes | % | |
|---|---|---|---|---|
| Democratic | Phillip Burton (Incumbent) | 86,647 | 72.0 | |
| Republican | Waldo Velasquez | 29,123 | 24.2 | |
| Peace and Freedom | Marvin Garson | 4,549 | 3.8 | |
| Total votes | 120,319 | 100.0 | ||
| Turnout | ||||
| Democratic hold | ||||
1970
| Party | Candidate | Votes | % | |
|---|---|---|---|---|
| Democratic | Phillip Burton (Incumbent) | 76,567 | 70.8 | |
| Republican | John E. Parks | 31,570 | 29.2 | |
| Total votes | 108,137 | 100.0 | ||
| Turnout | ||||
| Democratic hold | ||||
1972
| Party | Candidate | Votes | % | |
|---|---|---|---|---|
| Democratic | Phillip Burton (Incumbent) | 120,819 | 81.8 | |
| Republican | Edlo E. Powell | 26,963 | 18.2 | |
| Total votes | 147,782 | 100.0 | ||
| Turnout | ||||
| Democratic hold | ||||
1974
| Party | Candidate | Votes | % | |
|---|---|---|---|---|
| Democratic | John Burton (Incumbent) | 87,323 | 59.6 | |
| Republican | Thomas Caylor | 55,881 | 37.7 | |
| Peace and Freedom | Raymond Broshears | 3,999 | 2.7 | |
| Total votes | 147,203 | 100.0 | ||
| Turnout | ||||
| Democratic hold | ||||
1976
| Party | Candidate | Votes | % | |
|---|---|---|---|---|
| Democratic | John Burton (Incumbent) | 103,746 | 61.8 | |
| Republican | Branwell Fanning | 64,008 | 38.2 | |
| Total votes | 167,754 | 100.0 | ||
| Turnout | ||||
| Democratic hold | ||||
1978
| Party | Candidate | Votes | % | |
|---|---|---|---|---|
| Democratic | John Burton (Incumbent) | 106,046 | 66.8 | |
| Republican | Dolores Skore | 52,603 | 33.2 | |
| Total votes | 158,649 | 100.0 | ||
| Turnout | ||||
| Democratic hold | ||||
1980
| Party | Candidate | Votes | % | |
|---|---|---|---|---|
| Democratic | John Burton (Incumbent) | 101,105 | 51.1 | |
| Republican | Dennis McQuaid | 89,624 | 45.3 | |
| Libertarian | Dan P. Dougherty | 7,092 | 3.6 | |
| Total votes | 197,821 | 100.0 | ||
| Turnout | ||||
| Democratic hold | ||||
1982
| Party | Candidate | Votes | % | |
|---|---|---|---|---|
| Democratic | Phillip Burton (Incumbent) | 103,268 | 50.5 | |
| Republican | Milton Marks | 72,139 | 35.3 | |
| Libertarian | Justin Raimondo | 2,904 | 14.2 | |
| Total votes | 178,311 | 100.0 | ||
| Turnout | ||||
| Democratic hold | ||||
1983 (Special)
| Party | Candidate | Votes | % | |
|---|---|---|---|---|
| Democratic | Sala Burton | 56.9 | ||
| Republican | Duncan Lent Howard | 23.3 | ||
| Democratic | Richard Doyle | 8.4 | ||
| Republican | Tom Spinosa | 3.7 | ||
| Republican | Gary Richard Arnold | 2.0 | ||
| Democratic | Tibor Uskert | 1.4 | ||
| Republican | Bill Dunlap | 1.3 | ||
| Democratic | Evelyn K. Lantz | 1.1 | ||
| Democratic | Michael O. Plunkett | 0.7 | ||
| Peace and Freedom | Andrew R. "Paul" Kangas | 0.6 | ||
| Libertarian | Eric A. Garris | 0.5 | ||
| No party | Richard Stypman (Write-in) | |||
| No party | Samuel Unger (write-in) | |||
| Total votes | 100.0 | |||
| Turnout | ||||
| Democratic hold | ||||
1984
| Party | Candidate | Votes | % | |
|---|---|---|---|---|
| Democratic | Sala Burton (Incumbent) | 139,692 | 72.3 | |
| Republican | Tom Spinosa | 45,930 | 23.8 | |
| Libertarian | Joseph Fuhrig | 4,008 | 2.1 | |
| Peace and Freedom | Henry Clark | 3,574 | 1.8 | |
| Total votes | 193,204 | 100.0 | ||
| Turnout | ||||
| Democratic hold | ||||
1986
| Party | Candidate | Votes | % | |
|---|---|---|---|---|
| Democratic | Sala Burton (Incumbent) | 122,688 | 75.2 | |
| Republican | Mike Garza | 36,039 | 22.1 | |
| Libertarian | Samuel K. "Sam" Grove | 2,409 | 1.5 | |
| Peace and Freedom | Theodore Adrian "Ted" Zuur | 2,078 | 1.3 | |
| Total votes | 163,214 | 100.0 | ||
| Turnout | ||||
| Democratic hold | ||||
1987 (Special)
| Party | Candidate | Votes | % | |
|---|---|---|---|---|
| Democratic | Nancy Pelosi | 63.4 | ||
| Republican | Harriet Ross | 23.3 | ||
| Independent | Karen Edwards | 2.2 | ||
| Independent | Cathy Sedwick | 0.9 | ||
| Peace and Freedom | Theodore Adrian "Ted" Zurr | 1.5 | ||
| Libertarian | Samuel K. "Sam" Grove | 1.4 | ||
| Total votes | 100.0 | |||
| Turnout | ||||
| Democratic hold | ||||
1988
| Party | Candidate | Votes | % | |
|---|---|---|---|---|
| Democratic | Nancy Pelosi (Incumbent) | 133,530 | 76.4 | |
| Republican | Bruce Michael O'Neill | 33,692 | 19.3 | |
| Peace and Freedom | Theodore Adrian "Ted" Zuur | 3,975 | 2.3 | |
| Libertarian | Sam Grove | 3,561 | 2.0 | |
| Total votes | 174,758 | 100.0 | ||
| Turnout | ||||
| Democratic hold | ||||
1990
| Party | Candidate | Votes | % | |
|---|---|---|---|---|
| Democratic | Nancy Pelosi (Incumbent) | 120,633 | 77.2 | |
| Republican | Alan Nichols | 35,671 | 22.8 | |
| Total votes | 156,304 | 100.0 | ||
| Turnout | ||||
| Democratic hold | ||||
1992
| Party | Candidate | Votes | % | |
|---|---|---|---|---|
| Democratic | Robert Matsui (Incumbent) | 158,250 | 68.6 | |
| Republican | Robert S. Dinsmore | 58,698 | 25.5 | |
| American Independent | Gordon Mors | 4,745 | 2.1 | |
| Libertarian | Chris J. Rufer | 4,547 | 2.0 | |
| Green | Tian Harter | 4,316 | 1.9 | |
| No party | Bergeron (write-in) | 4 | 0.0 | |
| Total votes | 230,560 | 100.0 | ||
| Turnout | ||||
| Democratic hold | ||||
1994
| Party | Candidate | Votes | % | |
|---|---|---|---|---|
| Democratic | Robert Matsui (Incumbent) | 125,042 | 68.48 | |
| Republican | Robert S. Dinsmore | 52,905 | 28.97 | |
| American Independent | Gordon Mors | 4,649 | 2.55 | |
| Total votes | 182,596 | 100.0 | ||
| Turnout | ||||
| Democratic hold | ||||
1996
| Party | Candidate | Votes | % | |
|---|---|---|---|---|
| Democratic | Robert Matsui (Incumbent) | 142,618 | 70.5 | |
| Republican | Robert Dinsmore | 52,940 | 26.2 | |
| Libertarian | Joseph Miller | 2,548 | 1.2 | |
| American Independent | Gordon Mors | 2,231 | 1.1 | |
| Natural Law | Charles Kersey | 2,123 | 1.0 | |
| Total votes | 202,460 | 100.0 | ||
| Turnout | ||||
| Democratic hold | ||||
1998
| Party | Candidate | Votes | % | |
|---|---|---|---|---|
| Democratic | Robert Matsui (Incumbent) | 130,715 | 71.89 | |
| Republican | Robert Dinsmore | 47,307 | 26.02 | |
| Libertarian | Douglas Arthur Tuma | 3,746 | 2.06 | |
| Green | Ken Adams (write-in) | 70 | 0.04 | |
| Total votes | 181,838 | 100.0 | ||
| Turnout | ||||
| Democratic hold | ||||
2000
| Party | Candidate | Votes | % | |
|---|---|---|---|---|
| Democratic | Robert Matsui (Incumbent) | 147,025 | 68.1 | |
| Republican | Ken Payne | 55,945 | 25.9 | |
| Green | Ken Adams | 6,195 | 2.9 | |
| Libertarian | Cullene Lang | 3,746 | 1.7 | |
| Natural Law | Alan Barreca | 2,894 | 1.3 | |
| Total votes | 215,805 | 100.0 | ||
| Turnout | ||||
| Democratic hold | ||||
2002
| Party | Candidate | Votes | % | |
|---|---|---|---|---|
| Democratic | Robert Matsui (Incumbent) | 90,697 | 70.9 | |
| Republican | Richard Frankhuizen | 33,313 | 26.1 | |
| Libertarian | Timothy E. Roloff | 3,923 | 3.0 | |
| Total votes | 189,717 | 100.0 | ||
| Turnout | ||||
| Democratic hold | ||||
2004
| Party | Candidate | Votes | % | |
|---|---|---|---|---|
| Democratic | Robert Matsui (Incumbent) | 138,004 | 71.4 | |
| Republican | Mike Dugas | 45,120 | 23.4 | |
| Green | Pat Driscoll | 6,593 | 3.4 | |
| Peace and Freedom | John C. Reiger | 3,670 | 1.8 | |
| Total votes | 193,387 | 100.0 | ||
| Turnout | ||||
| Democratic hold | ||||
2005 (special)
Incumbent Robert Matsui died January 1, 2005. In a special election held on March 8, 2005 to fill the vacancy, Matsui's widow, Doris, won the seat with almost 68% of the vote. She was sworn in on March 10, 2005.
| Party | Candidate | Votes | % | |
|---|---|---|---|---|
| Democratic | Doris Matsui | 56,175 | 67.65 | |
| Democratic | Julie Padilla | 7,158 | 8.62 | |
| Republican | John Flynn | 6,559 | 7.90 | |
| Republican | Serge Chernay | 3,742 | 4.51 | |
| Republican | Michael O'Brien | 2,591 | 3.12 | |
| Republican | Shane Singh | 1,753 | 2.11 | |
| Republican | Bruce Stevens | 1,124 | 1.35 | |
| Green | Pat Driscoll | 976 | 1.18 | |
| Independent | Leonard Padilla | 916 | 1.10 | |
| Democratic | Charles Pineda | 659 | 0.79 | |
| Libertarian | Gale Morgan | 451 | 0.54 | |
| Peace and Freedom | John Reiger | 286 | 0.34 | |
| Democratic | Lara Shapiro (write-in) | 6 | 0.01 | |
| Invalid or blank votes | 637 | 0.77 | ||
| Total votes | 83,033 | 100.0 | ||
| Turnout | 27.72 | |||
| Democratic hold | ||||
2006
| Party | Candidate | Votes | % | |
|---|---|---|---|---|
| Democratic | Doris Matsui (Incumbent) | 89,119 | 70.7 | |
| Republican | Xiaochin Claire Yan | 29,824 | 23.7 | |
| Green | Jeff Kravitz | 5,394 | 4.3 | |
| Peace and Freedom | John C. Reiger | 1,716 | 1.3 | |
| Total votes | 126,053 | 100.0 | ||
| Turnout | ||||
| Democratic hold | ||||
2008
| Party | Candidate | Votes | % | |
|---|---|---|---|---|
| Democratic | Doris Matsui (Incumbent) | 164,242 | 74.3 | |
| Republican | Paul A. Smith | 46,002 | 20.9 | |
| Peace and Freedom | L. R. Roberts | 10,731 | 4.8 | |
| Independent | David B.Lynch (write-in candidate) | 180 | 0.0 | |
| Total votes | 221,155 | 100 | ||
| Turnout | ||||
| Democratic hold | ||||
2010
| Party | Candidate | Votes | % | |
|---|---|---|---|---|
| Democratic | Doris Matsui (Incumbent) | 124,220 | 72% | |
| Republican | Paul A. Smith | 43,577 | 25% | |
| Peace and Freedom | Gerald Allen Frink | 4,594 | 3% | |
| Total votes | 172,391 | 100% | ||
| Turnout | ||||
| Democratic hold | ||||
2012
| Party | Candidate | Votes | % | |
|---|---|---|---|---|
| Democratic | Mike Thompson (Incumbent) | 202,872 | 74.5% | |
| Republican | Randy Loftin | 69,545 | 25.5% | |
| Total votes | 272,417 | 100.0% | ||
| Democratic hold | ||||
2014
| Party | Candidate | Votes | % | |
|---|---|---|---|---|
| Democratic | Mike Thompson (Incumbent) | 129,613 | 75.7% | |
| No party preference | James Hinton | 41,535 | 24.3% | |
| Total votes | 171,148 | 100.0% | ||
| Democratic hold | ||||
2016
| Party | Candidate | Votes | % | |
|---|---|---|---|---|
| Democratic | Mike Thompson (Incumbent) | 224,526 | 76.9% | |
| Republican | Carlos Santamaria | 67,565 | 23.1% | |
| Total votes | 292,091 | 100.0% | ||
| Democratic hold | ||||
2018
| Party | Candidate | Votes | % | |
|---|---|---|---|---|
| Democratic | Mike Thompson (Incumbent) | 205,860 | 78.9% | |
| No party preference | Anthony Mills | 55,158 | 21.1% | |
| Total votes | 261,018 | 100.0% | ||
| Democratic hold | ||||
2020
| Party | Candidate | Votes | % | |
|---|---|---|---|---|
| Democratic | Mike Thompson (incumbent) | 271,233 | 76.1 | |
| Republican | Scott Giblin | 85,227 | 23.9 | |
| Total votes | 356,460 | 100.0 | ||
| Democratic hold | ||||
Timeline of representatives
The following timeline depicts the progression of the representatives and their political affiliation at the time of assuming office.

See also
- List of United States congressional districts
References
- "My Congressional District".
- "Introducing the 2021 Cook Political Report Partisan Voter Index". The Cook Political Report. April 15, 2021. Retrieved April 15, 2021.
- "Maps: Final Congressional Districts". Citizens Redistricting Commission. Archived from the original on March 10, 2013. Retrieved February 24, 2013.
- "CA 2022 Congressional". Dave's Redistricting. January 4, 2022. Retrieved November 11, 2022.
- Statement of Vote (2000 President) Archived June 11, 2007, at the Wayback Machine
- Statement of Vote (2000 Senator) Archived June 11, 2007, at the Wayback Machine
- Statement of Vote (2002 Governor) Archived November 11, 2010, at the Wayback Machine
- Statement of Vote (2003 Recall Question) Archived May 20, 2011, at the Wayback Machine
- Statement of Vote (2003 Governor) Archived May 20, 2011, at the Wayback Machine
- Statement of Vote (2004 President) Archived August 1, 2010, at the Wayback Machine
- Statement of Vote (2004 Senator) Archived August 10, 2011, at the Wayback Machine
- Statement of Vote (2006 Senator) Archived August 10, 2011, at the Wayback Machine
- "California Secretary of State. Supplement to the Statement of Vote. President. Counties by Congressional District" (PDF). Archived from the original (PDF) on October 18, 2012. Retrieved April 13, 2015.
- Statement of Vote (2010 Governor Archived May 20, 2011, at the Wayback Machine
- Statement of Vote (2010 Governor) Archived May 20, 2011, at the Wayback Machine
- http://elections.cdn.sos.ca.gov/sov/2012-general/ssov/pres-by-congress.pdf [bare URL PDF]
- http://elections.cdn.sos.ca.gov/sov/2012-general/ssov/us-senate-by-congress.pdfref [permanent dead link]
- http://elections.cdn.sos.ca.gov/sov/2014-general/ssov/governor-congressional.pdf [bare URL PDF]
- "General Election - Statement of Vote, November 8, 2016 :: California Secretary of State".
- "General Election - Statement of Vote, November 8, 2016 :: California Secretary of State".
- https://elections.cdn.sos.ca.gov/sov/2018-general/ssov/us-senate-by-congress.pdf [bare URL PDF]
- http://elections.cdn.sos.ca.gov/sov/2018-general/ssov/governor-congressional.pdf [bare URL PDF]
- "Daily Kos Elections' presidential results by congressional district for 2020, 2016, and 2012".
- "Counties by Congressional District for Recall Question" (PDF). sos.ca.gov. September 14, 2021. Retrieved May 2, 2022.
- 1920 election results
- 1922 election results
- 1923 special election results
- 1924 election results
- 1926 special election results
- 1926 election results
- 1928 election results
- 1930 election results
- 1932 election results
- 1934 election results
- 1936 election results
- 1938 election results
- 1940 election results
- 1942 election results
- 1944 election results
- 1946 election results
- 1948 election results
- 1949 special election results
- 1950 election results
- 1952 election results
- 1954 election results
- 1956 election results
- 1958 election results
- 1960 election results
- 1962 election results
- 1964 election results
- 1966 election results
- 1968 election results
- 1970 election results
- 1972 election results
- 1974 election results
- 1976 election results
- 1978 election results
- 1980 election results
- 1982 election results
- 1983 special election results
- 1984 election results
- 1986 election results
- 1987 special election results
- 1988 election results
- 1990 election results
- 1992 election results
- 1994 election results
- 1996 election results
- 1998 election results
- 2000 election results
- 2002 election results Archived February 3, 2009, at the Wayback Machine
- 2004 election results[permanent dead link]
- "Special Election Results" (PDF). Secretary of State of California. Archived from the original (PDF) on May 29, 2008. Retrieved May 29, 2008.
- 2006 election results Archived November 27, 2008, at the Wayback Machine
- Office of the California Secretary of State Archived December 21, 2008, at the Wayback Machine "United States Representative in Congress, (retrieved on August 9, 2009).
- Office of the California Secretary of State[permanent dead link] "United States Representative in Congress, (retrieved on March 24, 2011).
- https://elections.cdn.sos.ca.gov/sov/2012-general/06-sov-summary.xls
- https://elections.cdn.sos.ca.gov/sov/2014-general/xls/06-summary.xls
- https://elections.cdn.sos.ca.gov/sov/2016-general/sov/csv-candidates.xls
External links
- GovTrack.us: California's 5th congressional district
- RAND California Election Returns: District Definitions (out of date)
- California Voter Foundation map - CD05 (out of date)
- Interview of Paul Smith, Republican candidate for the 5th CD recorded July 15, 2008 in Sacramento, CA
Другой контент может иметь иную лицензию. Перед использованием материалов сайта WikiSort.org внимательно изучите правила лицензирования конкретных элементов наполнения сайта.
WikiSort.org - проект по пересортировке и дополнению контента Википедии