world.wikisort.org - USA
California's 22nd congressional district is a congressional district in the U.S. state of California. It is represented by Connie Conway, who replaced former Representative Devin Nunes, who resigned on January 1, 2022 to become chief executive officer of the Trump Media & Technology Group.
| California's 22nd congressional district | |||
|---|---|---|---|
Interactive map of district boundaries since 2023 (Used in the 2022 elections) | |||
| Representative |
| ||
| Population (2021) | 810,279 | ||
| Median household income | $70,933[1] | ||
| Ethnicity |
| ||
| Cook PVI | R+6[2] | ||
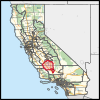


The district is in the San Joaquin Valley, comprising parts of Fresno and Tulare counties. It includes most of eastern Fresno and all of Clovis, Tulare, and Visalia.
Following redistricting in 2021, the district is still in the San Joaquin Valley. It includes most of Kings County and parts of Tulare County and Kern County. It includes the east side of Bakersfield, the west and south sides of Tulare, the south side of Hanford, and all of Porterville, Lindsay, Shafter, Wasco, Delano, McFarland, Arvin, Lamont, and Corcoran.[3] The new 22nd is a majority-Latino district.
Recent election results from statewide races
| Year | U.S. President | U.S. Senator (Class 1) | U.S. Senator (Class 3) | Governor of California |
|---|---|---|---|---|
| 1992 | Clinton 41.1–35.4% | Feinstein 48.7–43.3% | Herschensohn 47.6–43.5% | — |
| 1994 | — | Huffington 46.9–43.5% | — | Wilson 58.2–37.7% |
| 1996 | Dole 44.2–44.0% | — | — | — |
| 1998 | — | — | ?? | ?? |
| 2000 | Bush 48.8–44.6%[4] | Feinstein 47.8–42.7%[5] | — | — |
| 2002 | — | — | — | Simon 64.3–28.8%[6] |
| 2003 | — | — | — | |
| Schwarzenegger 62.9–15.6%[8] | ||||
| 2004 | Bush 67.9–31.0%[9] | — | Jones 59.7–35.5%[10] | — |
| 2006 | — | Mountjoy 57.3–37.4%[11] | — | Schwarzenegger 73.8–22.0%[12] |
| 2008 | McCain 59.7–38.3%[13] | — | — | — |
| 2010 | — | — | Fiorina 63.9–28.8% | Whitman 58.5–34.4% |
| 2012 | Romney 56.6–41.6% | Emken 56.8–43.2% | — | — |
| 2014 | — | — | — | Kashkari 60.3–39.7% |
| 2016 | Trump 52.1–42.6% | — | Harris 52.7–47.3% | — |
| 2018 | — | de Leon 55.7–43.3% | — | Cox 56.8–43.2% |
| 2020 | Trump 51.6–46.2% | — | — | — |
| 2021 | — | — | — |
List of members representing the district
| Member | Party | Dates | Cong ress(es) |
Electoral history | District location (counties) |
|---|---|---|---|---|---|
| District created January 3, 1943 | |||||
 John J. Phillips |
Republican | January 3, 1943 – January 3, 1953 |
78th 79th 80th 81st 82nd |
Elected in 1942. Re-elected in 1944. Re-elected in 1946. Re-elected in 1948. Re-elected in 1950. Redistricted to the 29th district. |
1943–1953 Imperial, Orange, Riverside |
 Joseph F. Holt |
Republican | January 3, 1953 – January 3, 1961 |
83rd 84th 85th 86th |
Elected in 1952. Re-elected in 1954. Re-elected in 1956. Re-elected in 1958. Retired. |
1953–1983 Los Angeles |
 James C. Corman |
Democratic | January 3, 1961 – January 3, 1975 |
87th 88th 89th 90th 91st 92nd 93rd |
Elected in 1960. Re-elected in 1962. Re-elected in 1964. Re-elected in 1966. Re-elected in 1968. Re-elected in 1970. Re-elected in 1972. Redistricted to the 21st district. | |
 Carlos J. Moorhead |
Republican | January 3, 1975 – January 3, 1993 |
94th 95th 96th 97th 98th 99th 100th 101st 102nd |
Redistricted from the 20th district and re-elected in 1974. Re-elected in 1976. Re-elected in 1978. Re-elected in 1980. Re-elected in 1982. Re-elected in 1984. Re-elected in 1986. Re-elected in 1988. Re-elected in 1990. Redistricted to the 27th district. | |
| 1983–1993 Los Angeles (northern L.A. suburbs) | |||||
 Michael Huffington |
Republican | January 3, 1993 – January 3, 1995 |
103rd | Elected in 1992. Retired to run for U.S. senator. |
1993–2003 San Luis Obispo, Santa Barbara |
 Andrea Seastrand |
Republican | January 3, 1995 – January 3, 1997 |
104th | Elected in 1994. Lost re-election. | |
 Walter Capps |
Democratic | January 3, 1997 – October 28, 1997 |
105th | Elected in 1996. Died. | |
| Vacant | October 28, 1997 – March 17, 1998 | ||||
 Lois Capps |
Democratic | March 17, 1998 – January 3, 2003 |
105th 106th 107th |
Elected to finish her husband's term. Re-elected later in 1998. Re-elected in 2000. Redistricted to the 23rd district. | |
 Bill Thomas |
Republican | January 3, 2003 – January 3, 2007 |
108th 109th |
Redistricted from the 21st district and re-elected in 2002. Re-elected in 2004. Retired. |
2003–2013 Kern, Los Angeles (Lancaster), inland San Luis Obispo |
 Kevin McCarthy |
Republican | January 3, 2007 – January 3, 2013 |
110th 111th 112th |
Elected in 2006. Re-elected in 2008. Re-elected in 2010. Redistricted to the 23rd district. | |
 Devin Nunes |
Republican | January 3, 2013 – January 1, 2022 |
113th 114th 115th 116th 117th |
Redistricted from the 21st district and re-elected in 2012. Re-elected in 2014. Re-elected in 2016. Re-elected in 2018. Re-elected in 2020. Resigned to become CEO of Trump Media & Technology Group. |
2013–present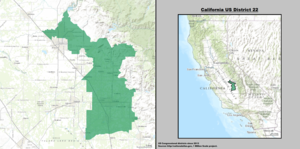 Fresno, Tulare (Fresno, Clovis, Tulare, Visalia) |
| Vacant | January 1, 2022 – June 14, 2022 |
117th | |||
 Connie Conway |
Republican | June 14, 2022 – present |
Elected to finish Nunes' term. Redistricted to the 20th district and retiring at end of term. | ||
Election results
1942
| Party | Candidate | Votes | % | ||
|---|---|---|---|---|---|
| Republican | John J. Phillips | 42,765 | 57.6% | ||
| Democratic | N. E. West | 31,440 | 42.4% | ||
| Total votes | 74,205 | 100.0% | |||
| Turnout | |||||
| Republican win (new seat) | |||||
1944
| Party | Candidate | Votes | % | |
|---|---|---|---|---|
| Republican | John J. Phillips (incumbent) | 88,537 | 100.0% | |
| Turnout | ||||
| Republican hold | ||||
1946
| Party | Candidate | Votes | % | |
|---|---|---|---|---|
| Republican | John J. Phillips (incumbent) | 59,935 | 62.1% | |
| Democratic | Ray Adkinson | 36,649 | 37.9% | |
| Total votes | 96,584 | 100.0% | ||
| Turnout | ||||
| Republican hold | ||||
1948
| Party | Candidate | Votes | % | |
|---|---|---|---|---|
| Republican | John J. Phillips (incumbent) | 115,697 | 100.0% | |
| Turnout | ||||
| Republican hold | ||||
1950
| Party | Candidate | Votes | % | |
|---|---|---|---|---|
| Republican | John J. Phillips (incumbent) | 114,497 | 100.0% | |
| Turnout | ||||
| Republican hold | ||||
1952
| Party | Candidate | Votes | % | ||
|---|---|---|---|---|---|
| Republican | Joseph F. Holt | 85,039 | 60.5% | ||
| Democratic | Dean E. McHenry | 55,534 | 39.5% | ||
| Total votes | 140,573 | 100.0% | |||
| Turnout | |||||
| Republican win (new seat) | |||||
1954
| Party | Candidate | Votes | % | |
|---|---|---|---|---|
| Republican | Joseph F. Holt (incumbent) | 65,165 | 58.2% | |
| Democratic | William M. "Bill" Costley | 46,875 | 41.8% | |
| Total votes | 112,040 | 100.0% | ||
| Turnout | ||||
| Republican hold | ||||
1956
| Party | Candidate | Votes | % | |
|---|---|---|---|---|
| Republican | Joseph F. Holt (incumbent) | 97,317 | 59.8% | |
| Democratic | Irving Glasband | 65,314 | 40.2% | |
| Total votes | 162,631 | 100.0% | ||
| Turnout | ||||
| Republican hold | ||||
1958
| Party | Candidate | Votes | % | |
|---|---|---|---|---|
| Republican | Joseph F. Holt (incumbent) | 87,785 | 55.4% | |
| Democratic | Irving Glasband | 70,777 | 44.6% | |
| Total votes | 158,562 | 100.0% | ||
| Turnout | ||||
| Republican hold | ||||
1960
| Party | Candidate | Votes | % | |||
|---|---|---|---|---|---|---|
| Democratic | James C. Corman | 104,919 | 51.1% | |||
| Republican | Lemoine Blanchard | 100,321 | 48.9% | |||
| Total votes | 205,240 | 100.0% | ||||
| Turnout | ||||||
| Democratic gain from Republican | ||||||
1962
| Party | Candidate | Votes | % | |
|---|---|---|---|---|
| Democratic | James C. Corman (incumbent) | 75,294 | 53.6% | |
| Republican | Charles S. Foote | 65,087 | 46.4% | |
| Total votes | 140,381 | 100.0% | ||
| Turnout | ||||
| Democratic hold | ||||
1964
| Party | Candidate | Votes | % | |
|---|---|---|---|---|
| Democratic | James C. Corman (incumbent) | 94,141 | 50.5% | |
| Republican | Robert C. Cline | 92,133 | 49.5% | |
| Total votes | 186,274 | 100.0% | ||
| Turnout | ||||
| Democratic hold | ||||
1966
| Party | Candidate | Votes | % | |
|---|---|---|---|---|
| Democratic | James C. Corman (incumbent) | 94,420 | 53.5% | |
| Republican | Robert C. Cline | 82,207 | 46.5% | |
| Total votes | 176,627 | 100.0% | ||
| Turnout | ||||
| Democratic hold | ||||
1968
| Party | Candidate | Votes | % | |
|---|---|---|---|---|
| Democratic | James C. Corman (incumbent) | 102,332 | 56.9% | |
| Republican | Joe Holt | 74,433 | 41.4% | |
| Peace and Freedom | Hugh Manes | 3,024 | 1.7% | |
| Total votes | 179,789 | 100.0% | ||
| Turnout | ||||
| Democratic hold | ||||
1970
| Party | Candidate | Votes | % | |
|---|---|---|---|---|
| Democratic | James C. Corman (incumbent) | 95,256 | 59.4% | |
| Republican | Tom Hayden | 63,297 | 39.5% | |
| American Independent | Callis R. Johnson | 1,880 | 1.1% | |
| Total votes | 160,433 | 100.0% | ||
| Turnout | ||||
| Democratic hold | ||||
1972
| Party | Candidate | Votes | % | |
|---|---|---|---|---|
| Democratic | James C. Corman (incumbent) | 121,352 | 67.6% | |
| Republican | Bruce P. Wolfe | 52,664 | 29.3% | |
| Peace and Freedom | Ralph L. Shroyer | 5,583 | 3.1% | |
| Total votes | 179,599 | 100.0% | ||
| Turnout | ||||
| Democratic hold | ||||
1974
| Party | Candidate | Votes | % | |||
|---|---|---|---|---|---|---|
| Republican | Carlos Moorhead (incumbent) | 78,983 | 55.8% | |||
| Democratic | Richard Hallin | 62,770 | 44.2% | |||
| Total votes | 141,753 | 100.0% | ||||
| Turnout | ||||||
| Republican gain from Democratic | ||||||
1976
| Party | Candidate | Votes | % | |
|---|---|---|---|---|
| Republican | Carlos Moorhead (incumbent) | 114,769 | 62.6% | |
| Democratic | Robert S. Henry | 68,543 | 37.4% | |
| Total votes | 183,312 | 100.0% | ||
| Turnout | ||||
| Republican hold | ||||
1978
| Party | Candidate | Votes | % | |
|---|---|---|---|---|
| Republican | Carlos Moorhead (incumbent) | 99,502 | 64.6% | |
| Democratic | Robert S. Henry | 54,442 | 35.4% | |
| Total votes | 153,944 | 100.0% | ||
| Turnout | ||||
| Republican hold | ||||
1980
| Party | Candidate | Votes | % | |
|---|---|---|---|---|
| Republican | Carlos Moorhead (incumbent) | 115,241 | 63.9% | |
| Democratic | Pierce O'Donnell | 57,477 | 31.9% | |
| Libertarian | William V. Susel | 7,705 | 4.3% | |
| Total votes | 180,423 | 100.0% | ||
| Turnout | ||||
| Republican hold | ||||
1982
| Party | Candidate | Votes | % | |
|---|---|---|---|---|
| Republican | Carlos Moorhead (incumbent) | 145,831 | 73.6% | |
| Democratic | Harvey L. Goldhammer | 46,521 | 23.5% | |
| Libertarian | Robert T. Gerringer | 5,870 | 3.0% | |
| Total votes | 198,222 | 100.0% | ||
| Turnout | ||||
| Republican hold | ||||
1984
| Party | Candidate | Votes | % | |
|---|---|---|---|---|
| Republican | Carlos Moorhead (incumbent) | 184,981 | 85.2% | |
| Libertarian | Michael B. Yauch | 32,036 | 14.8% | |
| Total votes | 217,017 | 100.0% | ||
| Turnout | ||||
| Republican hold | ||||
1986
| Party | Candidate | Votes | % | |
|---|---|---|---|---|
| Republican | Carlos Moorhead (incumbent) | 141,096 | 73.8% | |
| Democratic | John G. Simmons | 44,036 | 23.0% | |
| Libertarian | Jona Joy Bergland | 3,114 | 1.6% | |
| Peace and Freedom | Joel Lorimer | 2,930 | 1.5% | |
| Total votes | 191,176 | 100.0% | ||
| Turnout | ||||
| Republican hold | ||||
1988
| Party | Candidate | Votes | % | |
|---|---|---|---|---|
| Republican | Carlos Moorhead (incumbent) | 164,699 | 69.5% | |
| Democratic | John G. Simmons | 61,555 | 26.0% | |
| Peace and Freedom | Shirley Rachel Isaacson | 6,298 | 2.7% | |
| Libertarian | Ted Brown | 4,259 | 1.8% | |
| Total votes | 235,811 | 100.0% | ||
| Turnout | ||||
| Republican hold | ||||
1990
| Party | Candidate | Votes | % | |
|---|---|---|---|---|
| Republican | Carlos Moorhead (incumbent) | 108,634 | 60.0% | |
| Democratic | David Bayer | 61,630 | 34.1% | |
| Libertarian | William H. Wilson | 6,702 | 3.7% | |
| Peace and Freedom | Jan B. Tucker | 3,963 | 2.2% | |
| Total votes | 180,929 | 100.0% | ||
| Turnout | ||||
| Republican hold | ||||
1992
| Party | Candidate | Votes | % | |
|---|---|---|---|---|
| Republican | Michael Huffington | 131,242 | 52.5% | |
| Democratic | Gloria Ochoa | 87,328 | 34.9% | |
| Green | Mindy Lorenz | 23,699 | 9.5% | |
| Libertarian | William Howard Dilbeck | 7,553 | 3.0% | |
| No party | Bialosky (write-in) | 104 | 0.1% | |
| Total votes | 249,926 | 100.0% | ||
| Turnout | ||||
| Republican hold | ||||
1994
| Party | Candidate | Votes | % | |
|---|---|---|---|---|
| Republican | Andrea Seastrand | 102,987 | 49.27% | |
| Democratic | Walter Capps | 101,424 | 48.53% | |
| Libertarian | David L. Bersohn | 4,597 | 2.20% | |
| Total votes | 209,008 | 100.0% | ||
| Turnout | ||||
| Republican hold | ||||
1996
| Party | Candidate | Votes | % | |||
|---|---|---|---|---|---|---|
| Democratic | Walter Capps | 118,299 | 48.5% | |||
| Republican | Andrea Seastrand (incumbent) | 107,987 | 44.3% | |||
| Independent | Steven Wheeler | 9,845 | 4.0% | |||
| Reform | Richard Porter | 3,975 | 1.6% | |||
| Libertarian | David Bersohn | 2,233 | 0.9% | |||
| Natural Law | Dawn Tomastik | 1,847 | 0.7% | |||
| Total votes | 244,186 | 100.0% | ||||
| Turnout | ||||||
| Democratic gain from Republican | ||||||
1998 (special)
| Party | Candidate | Votes | % | |
|---|---|---|---|---|
| Democratic | Lois Capps | 93,392 | 53.46% | |
| Republican | Tom Bordonaro | 78,224 | 44.78% | |
| Libertarian | Robert Bakhaus | 3,079 | 1.76% | |
| Total votes | 174,695 | 100.00% | ||
| Turnout | ||||
| Democratic hold | ||||
1998
| Party | Candidate | Votes | % | |
|---|---|---|---|---|
| Democratic | Lois Capps (incumbent) | 111,388 | 55.09% | |
| Republican | Tom J. Bordonaro Jr. | 86,921 | 42.99% | |
| Libertarian | Robert Bakhaus | 2,618 | 1.29% | |
| Reform | Richard D. "Dick" Porter | 1,263 | 0.62% | |
| Total votes | 202,190 | 100.0% | ||
| Turnout | ||||
| Democratic hold | ||||
2000
| Party | Candidate | Votes | % | |
|---|---|---|---|---|
| Democratic | Lois Capps (incumbent) | 135,538 | 53.2% | |
| Republican | Mike Stoker | 113,094 | 44.4% | |
| Reform | Richard D. "Dick" Porter | 2,490 | 0.9% | |
| Libertarian | Joe Furcinite | 2,060 | 0.8% | |
| Natural Law | J. Carlos Aguirre | 1,888 | 0.7% | |
| Total votes | 255,070 | 100.0% | ||
| Turnout | ||||
| Democratic hold | ||||
2002
| Party | Candidate | Votes | % | |||
|---|---|---|---|---|---|---|
| Republican | Bill Thomas | 120,473 | 73.4% | |||
| Democratic | Jaime A. Corvera | 38,988 | 23.7% | |||
| Libertarian | Frank Coates | 4,824 | 2.9% | |||
| Total votes | 164,285 | 100.0% | ||||
| Turnout | ||||||
| Republican gain from Democratic | ||||||
2004
| Party | Candidate | Votes | % | |
|---|---|---|---|---|
| Republican | Bill Thomas (incumbent) | 209,384 | 100.0% | |
| Turnout | ||||
| Republican hold | ||||
2006
| Party | Candidate | Votes | % | |
|---|---|---|---|---|
| Republican | Kevin McCarthy | 133,278 | 70.8% | |
| Democratic | Sharon M. Beery | 55,226 | 29.2% | |
| Total votes | 188,504 | 100.0% | ||
| Turnout | ||||
| Republican hold | ||||
2008
| Party | Candidate | Votes | % | |
|---|---|---|---|---|
| Republican | Kevin McCarthy (incumbent) | 224,549 | 100.0% | |
| Total votes | 224,549 | 100.0% | ||
| Turnout | ||||
| Republican hold | ||||
2010
| Party | Candidate | Votes | % | |
|---|---|---|---|---|
| Republican | Kevin McCarthy (incumbent) | 173,490 | 98.8% | |
| Independent | John Uebersax (write-in) | 2,173 | 1.2% | |
| Total votes | 175,663 | 100.0% | ||
| Turnout | ||||
| Republican hold | ||||
2012
| Party | Candidate | Votes | % | |
|---|---|---|---|---|
| Republican | Devin Nunes (incumbent) | 132,386 | 61.9% | |
| Democratic | Otto Lee | 81,555 | 38.1% | |
| Total votes | 213,941 | 100.0% | ||
| Republican hold | ||||
2014
| Party | Candidate | Votes | % | |
|---|---|---|---|---|
| Republican | Devin Nunes (incumbent) | 96,053 | 72.0% | |
| Democratic | Suzanna "Sam" Aguilera-Marrero | 37,289 | 28.0% | |
| Total votes | 133,342 | 100.0% | ||
| Republican hold | ||||
2016
| Party | Candidate | Votes | % | |
|---|---|---|---|---|
| Republican | Devin Nunes (incumbent) | 158,755 | 67.6% | |
| Democratic | Louie J. Campos | 76,211 | 32.4% | |
| Total votes | 234,966 | 100.0% | ||
| Republican hold | ||||
2018
| Party | Candidate | Votes | % | |
|---|---|---|---|---|
| Republican | Devin Nunes (incumbent) | 117,243 | 52.7% | |
| Democratic | Andrew Janz | 105,136 | 47.3% | |
| Total votes | 222,379 | 100.0% | ||
| Republican hold | ||||
2020
| Party | Candidate | Votes | % | |
|---|---|---|---|---|
| Republican | Devin Nunes (incumbent) | 151,864 | 54.2% | |
| Democratic | Phil Arballo | 128,564 | 45.8% | |
| Total votes | 280,428 | 100.0% | ||
| Republican hold | ||||
2022 (special)
| Party | Candidate | Votes | % | |
|---|---|---|---|---|
| Republican | Connie Conway | 69,954 | 62.1% | |
| Democratic | Lourin Hubbard | 42,688 | 37.9% | |
| Total votes | 112,642 | 100.0% | ||
| Republican hold | ||||
Historical district boundaries

See also
- List of United States congressional districts
References
- Center for New Media & Promotion (CNMP), US Census Bureau. "My Congressional District". www.census.gov.
- "Partisan Voting Index – Districts of the 115th Congress" (PDF). The Cook Political Report. April 7, 2017. Retrieved April 7, 2017.
- "CA 2022 Congressional". Dave's Redistricting. January 4, 2022. Retrieved November 11, 2022.
- "Statement of Vote (2000 U.S. President)" (PDF). Archived from the original (PDF) on June 11, 2007. Retrieved September 17, 2008.
- "Statement of Vote (2000 U.S. Senator)" (PDF). Archived from the original (PDF) on June 11, 2007. Retrieved September 17, 2008.
- "Statement of Vote (2002 Governor)" (PDF). Archived from the original (PDF) on November 11, 2010.
- "Statement of Vote (2003 Recall Question)" (PDF). Archived from the original (PDF) on May 20, 2011. Retrieved October 8, 2007.
- "Statement of Vote (2003 Governor)" (PDF). Archived from the original (PDF) on May 20, 2011. Retrieved October 8, 2007.
- "Statement of Vote (2004 U.S. President)" (PDF). Archived from the original (PDF) on August 1, 2010. Retrieved August 8, 2007.
- "Statement of Vote (2004 U.S. Senator)" (PDF). Archived from the original (PDF) on August 10, 2011.
- "Statement of Vote (2006 U.S. Senator)" (PDF). Archived from the original (PDF) on August 10, 2011.
- "Statement of Vote (2006 Governor)" (PDF). Archived from the original (PDF) on August 10, 2011.
- "(2008 U.S. President)". Archived from the original on May 17, 2009. Retrieved March 5, 2009.
- "Counties by Congressional District for Recall Question" (PDF). sos.ca.gov. September 14, 2021. Retrieved May 2, 2022.
- "1942 election results" (PDF).
- "1944 election results" (PDF).
- "1946 election results" (PDF).
- "1948 election results" (PDF).
- "1950 election results" (PDF).
- "1952 election results" (PDF).
- "1954 election results" (PDF).
- "1956 election results" (PDF).
- "1958 election results" (PDF).
- "1960 election results" (PDF).
- "1962 election results" (PDF).
- "1964 election results" (PDF).
- "1966 election results" (PDF).
- "1968 election results" (PDF).
- "1970 election results" (PDF).
- "1972 election results" (PDF).
- "1974 election results" (PDF).
- "1976 election results" (PDF).
- "1978 election results" (PDF).
- "1980 election results" (PDF).
- "1982 election results" (PDF).
- "1984 election results" (PDF).
- "1986 election results" (PDF).
- "1988 election results" (PDF).
- "1990 election results" (PDF).
- "1992 election results" (PDF).
- "1994 election results" (PDF).
- "1996 election results" (PDF).
- "JoinCalifornia - 03-10-1998 Election". www.joincalifornia.com.
- "1998 election results" (PDF).
- "2000 election results" (PDF).
- "2002 general election results" (PDF). Archived from the original (PDF) on February 3, 2009.
- "2004 general election results" (PDF). Archived from the original (PDF) on August 21, 2008.
- "2006 general election results" (PDF). Archived from the original (PDF) on November 27, 2008.
- "2008 general election results" (PDF). Archived from the original (PDF) on December 21, 2008.
- "2010 general election results" (PDF). Archived from the original (PDF) on May 20, 2011. Retrieved February 11, 2011.
- "2012 general election results" (PDF). Archived from the original (PDF) on October 19, 2013.
- "U.S. House of Representatives District 22 - Districtwide Results". Archived from the original on January 6, 2015. Retrieved December 21, 2014.
External links
- GovTrack.us: California's 22nd congressional district
- RAND California Election Returns: District Definitions
- California Voter Foundation map - CD22
| Authority control |
|
|---|
Другой контент может иметь иную лицензию. Перед использованием материалов сайта WikiSort.org внимательно изучите правила лицензирования конкретных элементов наполнения сайта.
WikiSort.org - проект по пересортировке и дополнению контента Википедии