world.wikisort.org - USA
California's 17th congressional district is a congressional district in the U.S. state of California that is currently represented by Ro Khanna. It is located in the South Bay and East Bay regions of the San Francisco Bay Area.
| California's 17th congressional district | |||
|---|---|---|---|
Interactive map of district boundaries since 2023 (Used in the 2022 elections) | |||
| Representative |
| ||
| Population (2021) | 771,306 | ||
| Median household income | $159,361[1] | ||
| Ethnicity |
| ||
| Cook PVI | D+24[2] | ||


The district includes parts of Alameda County and Santa Clara County. It encompasses the cities of Sunnyvale, Cupertino, Santa Clara, Milpitas, Newark, the majority of Fremont, and the northernmost and westernmost parts of San Jose. The district includes the campus of Santa Clara University and the corporate headquarters of Apple Inc, Intel Corp., and Yahoo. It is the only majority-Asian district in the contiguous United States.
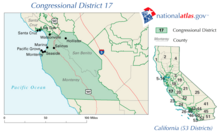
From 2003 to 2013, the district covered all of Monterey and San Benito counties, as well as part of Santa Cruz County. It included all of the coastal communities surrounding Monterey Bay, the city of Salinas, and the vast majority of the Salinas Valley. The district was mostly unchanged during the 2021 redistricting.
Recent results from statewide elections
| Year | Office | Results |
|---|---|---|
| 1992 | President | Clinton 52.7 – 27.3% |
| Senator | Boxer 54.3 – 35.8% | |
| Senator | Feinstein 63.2 – 30.5% | |
| 1994 | Governor[3] | Wilson 48.2 – 47.3% |
| Senator[4] | Feinstein 51.1 – 38.8% | |
| 1996 | President[5] | Clinton 55.3 – 32.3% |
| 1998 | Governor[6] | Davis 62.6 – 32.5% |
| Senator[7] | Boxer 57.7 – 37.9% | |
| 2000 | President[8] | Gore 59.6 – 33.0% |
| Senator[9] | Feinstein 58.3 – 32.5% | |
| 2002 | Governor[10] | Davis 55.4 – 32.3% |
| 2003 | Recall[11][12] | |
| Bustamante 40.0 – 37.8% | ||
| 2004 | President[13] | Kerry 65.6 – 33.0% |
| Senator[14] | Boxer 66.0 – 28.9% | |
| 2006 | Governor[15] | Schwarzenegger 48.1 – 44.6% |
| Senator[16] | Feinstein 68.8 – 24.8% | |
| 2008 | President[17] | Obama 72.1 – 25.8% |
| 2010 | Governor | Brown 63.8 – 31.3% |
| Senator | Boxer 62.7 – 31.3% | |
| 2012 | President | Obama 71.9 – 25.5% |
| Senator | Feinstein 74.8 – 25.2% | |
| 2014 | Governor | Brown 74.6 – 25.4% |
| 2016 | President | Clinton 73.9 – 20.5% |
| Senator | Harris 68.0 – 32.0% | |
| 2018 | Governor | Newsom 71.5 – 28.5% |
| Senator | Feinstein 60.3 – 39.7% | |
| 2020 | President | Biden 72.5 – 25.5% |
| 2021 | Recall[18] |
Composition
| # | County | Seat | Population |
|---|---|---|---|
| 1 | Alameda | Oakland | 1,682,353 |
| 85 | Santa Clara | San Jose | 1,885,508 |
As of the 2020 redistricting, California's 17th congressional district takes up the Tri-City area of the San Francisco Bay Area. It takes up the western borders of Alameda and Santa Clara Counties.
Alameda County is split between this district and the 14th district. They are partitioned by Mission Peak Regional Park, Witherly Ln, Mission Blvd, Washington Blvd, Farallon Cmn, Paseo Padre Parkway, Grimmer Blvd, Blacow Rd, Omar St, Butano Park Dr, Farina Ln, Nimitz Freeway, Highway 84. The 17th district takes in the south side of the city of Fremont, and the city of Newark.
Santa Clara County is split between this district, the 16th district, and the 18th district. The 17th and 16th are partitioned by Stevens Creek Blvd, Santana Row, Olsen Dr, S Winchester Blvd, Williams Rd, Eden Ave, Lexington Dr, Valley Forge Way, Gleason Ave, Moreland Way, Payne Ave, Saratoga Ave, Doyle Rd, Highway G2, Royal Ann Dr, Wisteria Way, Rainbow Dr, Highway 85, S De Anza Blvd, Prospect Rd, Fremont Older Open Space, Permanente Creek, Highway 280, N Foothill Blvd, Homestead Rd, Stevens Creek, W EL Camino Real, Magritte Way, Highway G6, Highway 101, and Enterprise Way. The 17th and 18th are partitioned by Steven’s Creek Blvd, Di Salvo Ave, Bellerose Dr, Forest Ave, Wabash Ave, W San Carlos St, Race St, The Alameda, University Ave, Elm St, Highway 82, Newhall St, Morse St, Idaho St, Alameda Ct, Sherwood Ave, Hamline St, Highway 880, Highway 101, McKee Rd, Toyon Ave, Penitencia Creek Rd, Canon Vista Ave, Crothers Rd, Alum Rock Park, Sierra Rd, Felter Rd, Weller Rd. The 17th district takes in the north side of the city of San Jose, the cities of Milpitas, Santa Clara, Sunnyvale, and Cupertino.
Cities & CDP with 10,000 or more people
- San Jose - 1,013,240
- Fremont - 230,504
- Sunnyvale - 155,805
- Santa Clara - 127,647
- Milpitas - 80,273
- Cupertino - 57,820
- Newark - 47,529
List of members representing the district
| Representative | Party | Dates | Cong ress(es) |
Electoral history | Counties |
|---|---|---|---|---|---|
| District created March 4, 1933 | |||||
 Charles J. Colden |
Democratic | March 4, 1933 – April 15, 1938 |
73rd 74th 75th |
Elected in 1932. Re-elected in 1934. Re-elected in 1936. Died. |
Los Angeles |
| Vacant | April 15, 1938 – January 3, 1939 |
75th | |||
 Lee E. Geyer |
Democratic | January 3, 1939 – October 11, 1941 |
76th 77th |
Elected in 1938. Re-elected in 1940. Died. | |
| Vacant | October 11, 1941 – August 25, 1942 |
77th | |||
 Cecil R. King |
Democratic | August 25, 1942 – January 3, 1969 |
77th 78th 79th 80th 81st 82nd 83rd 84th 85th 86th 87th 88th 89th 90th |
Elected to finish Geyer's term. Re-elected in 1942. Re-elected in 1944. Re-elected in 1946. Re-elected in 1948. Re-elected in 1950. Re-elected in 1952. Re-elected in 1954. Re-elected in 1956. Re-elected in 1958. Re-elected in 1960. Re-elected in 1962. Re-elected in 1964. Re-elected in 1966. Retired. | |
 Glenn M. Anderson |
Democratic | January 3, 1969 – January 3, 1973 |
91st 92nd |
Elected in 1968. Re-elected in 1970. Redistricted to the 35th district. | |
 Pete McCloskey |
Republican | January 3, 1973 – January 3, 1975 |
93rd | Redistricted from the 11th district and re-elected in 1972. Redistricted to the 12th district |
Southern San Mateo, small part of northwestern Santa Clara |
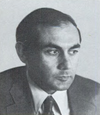
 John Hans Krebs |
Democratic | January 3, 1975 – January 3, 1979 |
94th 95th |
Elected in 1974. Re-elected in 1976. Lost re-election. |
Eastern Fresno, Kings, northwestern Tulare |
 Charles (Chip) Pashayan |
Republican | January 3, 1979 – January 3, 1983 |
96th 97th |
Elected in 1978. Re-elected in 1980. | |
| January 3, 1983 – January 3, 1991 |
98th 99th 100th 101st |
Re-elected in 1982. Re-elected in 1984. Re-elected in 1986. Re-elected in 1988. Lost re-election. |
Eastern Fresno, Kings, Kern (Bakersfield), Tulare | ||
 Cal Dooley |
Democratic | January 3, 1991 – January 3, 1993 |
102nd | Elected in 1990. Redistricted to the 20th district. | |
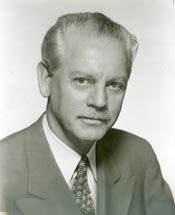
 Leon Panetta |
Democratic | January 3, 1993 – January 23, 1993 |
103rd | Redistricted from the 16th district and re-elected in 1992. Appointed Director of the OMB |
Monterey, San Benito, southern Santa Cruz |
| Vacant | January 23, 1993 – June 8, 1993 | ||||
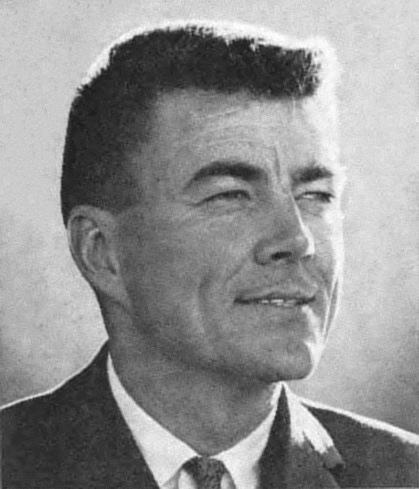
 Sam Farr |
Democratic | June 8, 1993 – January 3, 2013 |
103rd 104th 105th 106th 107th 108th 109th 110th 111th 112th |
Elected to finish Panetta's term. Re-elected in 1994. Re-elected in 1996. Re-elected in 1998. Re-elected in 2000. Re-elected in 2002. Re-elected in 2004. Re-elected in 2006. Re-elected in 2008. Re-elected in 2010. Redistricted to the 20th district. | |
 Mike Honda |
Democratic | January 3, 2013 – January 3, 2017 |
113th 114th |
Redistricted from the 15th district and re-elected in 2012. Re-elected in 2014. Lost re-election. |
Southern Alameda, western Santa Clara |
 Ro Khanna |
Democratic | January 3, 2017 – Present |
115th 116th 117th |
Elected in 2016. Re-elected in 2018. Re-elected in 2020. Re-elected in 2022. | |
Election results
|
1932 • 1934 • 1936 • 1938 • 1940 • 1942 (Special) • 1942 • 1944 • 1946 • 1948 • 1950 • 1952 • 1954 • 1956 • 1958 • 1960 • 1962 • 1964 • 1966 • 1968 • 1970 • 1972 • 1974 • 1976 • 1978 • 1980 • 1982 • 1984 • 1986 • 1988 • 1990 • 1992 • 1993 (Special) • 1994 • 1996 • 1998 • 2000 • 2002 • 2004 • 2006 • 2008 • 2010 • 2012 • 2014 • 2016 • 2018 • 2020 |
1932
| Party | Candidate | Votes | % | ||
|---|---|---|---|---|---|
| Democratic | Charles J. Colden | 50,720 | 62.2 | ||
| Republican | A. E. Henning | 26,868 | 32.9 | ||
| Liberty | Ernest E. Debs | 3,965 | 4.9 | ||
| Total votes | 81,553 | 100.0 | |||
| Turnout | |||||
| Democratic win (new seat) | |||||
1934
| Party | Candidate | Votes | % | |
|---|---|---|---|---|
| Democratic | Charles J. Colden (incumbent) | 60,045 | 70.4 | |
| Republican | C. P. "Cap" Wright | 20,508 | 24.0 | |
| Socialist | Richard Pomeroy | 4,721 | 5.6 | |
| Total votes | 85,274 | 100.0 | ||
| Turnout | ||||
| Democratic hold | ||||
1936
| Party | Candidate | Votes | % | |
|---|---|---|---|---|
| Democratic | Charles J. Colden (incumbent) | 68,189 | 71.9 | |
| Republican | Leonard Roach | 24,981 | 26.3 | |
| Communist | John L. Leech | 1,634 | 1.8 | |
| Total votes | 94,804 | 100.0 | ||
| Turnout | ||||
| Democratic hold | ||||
1938
| Party | Candidate | Votes | % | |
|---|---|---|---|---|
| Democratic | Lee E. Geyer (incumbent) | 56,513 | 58.8 | |
| Republican | Clifton A. Hix | 26,891 | 28.0 | |
| Townsend | Fred C. Wagner | 8,870 | 9.2 | |
| Progressive | Robert O. Bates | 3,774 | 3.9 | |
| Total votes | 96,048 | 100.0 | ||
| Turnout | ||||
| Democratic hold | ||||
1940
| Party | Candidate | Votes | % | |
|---|---|---|---|---|
| Democratic | Lee E. Geyer (incumbent) | 75,109 | 65.5 | |
| Republican | Clifton A. Hix | 32,862 | 28.6 | |
| Progressive | Samuel C. Converse | 5,649 | 4.9 | |
| Communist | Harry L. Gray | 1,118 | 1.0 | |
| Total votes | 114,738 | 100.0 | ||
| Turnout | ||||
| Democratic hold | ||||
1942 (Special)
Democrat Cecil R. King won the special election to replace fellow Democrat Lee E. Geyer, who died in office. Data for this special election is not available.[24]
1942
| Party | Candidate | Votes | % | |
|---|---|---|---|---|
| Democratic | Cecil R. King (incumbent) | 92,260 | 100.0 | |
| Turnout | ||||
| Democratic hold | ||||
1944
| Party | Candidate | Votes | % | |
|---|---|---|---|---|
| Democratic | Cecil R. King (incumbent) | 147,217 | 100.0 | |
| Turnout | ||||
| Democratic hold | ||||
1946
| Party | Candidate | Votes | % | |
|---|---|---|---|---|
| Democratic | Cecil R. King (incumbent) | 110,654 | 100.0 | |
| Turnout | ||||
| Democratic hold | ||||
1948
| Party | Candidate | Votes | % | |
|---|---|---|---|---|
| Democratic | Cecil R. King (incumbent) | 194,782 | 100.0 | |
| Turnout | ||||
| Democratic hold | ||||
1950
| Party | Candidate | Votes | % | |
|---|---|---|---|---|
| Democratic | Cecil R. King (incumbent) | 166,334 | 100.0 | |
| Turnout | ||||
| Democratic hold | ||||
1952
| Party | Candidate | Votes | % | |
|---|---|---|---|---|
| Democratic | Cecil R. King (incumbent) | 114,650 | 54.6 | |
| Republican | Robert H. Finch | 92,587 | 44.1 | |
| Progressive | Loyd C. Seelinger | 2,738 | 1.3 | |
| Total votes | 209,975 | 100.0 | ||
| Turnout | ||||
| Democratic hold | ||||
1954
| Party | Candidate | Votes | % | |
|---|---|---|---|---|
| Democratic | Cecil R. King (incumbent) | 97,828 | 60.1 | |
| Republican | Robert H. Finch | 64,967 | 39.9 | |
| Total votes | 162,795 | 100.0 | ||
| Turnout | ||||
| Democratic hold | ||||
1956
| Party | Candidate | Votes | % | |
|---|---|---|---|---|
| Democratic | Cecil R. King (incumbent) | 157,270 | 64.9 | |
| Republican | Charles A. Franklin | 84,900 | 35.1 | |
| Total votes | 242,170 | 100.0 | ||
| Turnout | ||||
| Democratic hold | ||||
1958
| Party | Candidate | Votes | % | |
|---|---|---|---|---|
| Democratic | Cecil R. King (incumbent) | 182,965 | 75.3 | |
| Republican | Charles A. Franklin | 59,973 | 24.7 | |
| Total votes | 242,938 | 100.0 | ||
| Turnout | ||||
| Democratic hold | ||||
1960
| Party | Candidate | Votes | % | |
|---|---|---|---|---|
| Democratic | Cecil R. King (incumbent) | 206,620 | 67.7 | |
| Republican | Tom Coffee | 98,510 | 32.3 | |
| Total votes | 305,130 | 100.0 | ||
| Turnout | ||||
| Democratic hold | ||||
1962
| Party | Candidate | Votes | % | |
|---|---|---|---|---|
| Democratic | Cecil R. King (incumbent) | 74,964 | 73.8 | |
| Republican | Ted Bruinsma | 36,663 | 26.2 | |
| Total votes | 111,627 | 100.0 | ||
| Turnout | ||||
| Democratic hold | ||||
1964
| Party | Candidate | Votes | % | |
|---|---|---|---|---|
| Democratic | Cecil R. King (incumbent) | 95,640 | 67.7 | |
| Republican | Robert Muncaster | 45,688 | 32.3 | |
| Total votes | 141,328 | 100.0 | ||
| Turnout | ||||
| Democratic hold | ||||
1966
| Party | Candidate | Votes | % | |
|---|---|---|---|---|
| Democratic | Cecil R. King (incumbent) | 76,962 | 60.8 | |
| Republican | Don Cortum | 49,615 | 39.2 | |
| Total votes | 126,577 | 100.0 | ||
| Turnout | ||||
| Democratic hold | ||||
1968
| Party | Candidate | Votes | % | |
|---|---|---|---|---|
| Democratic | Glenn M. Anderson | 75,070 | 50.7 | |
| Republican | Joe Blatchford | 71,174 | 48.1 | |
| Peace and Freedom | Ben Dobbs | 1,685 | 1.1 | |
| Total votes | 147,929 | 100.0 | ||
| Turnout | ||||
| Democratic hold | ||||
1970
| Party | Candidate | Votes | % | |
|---|---|---|---|---|
| Democratic | Glenn M. Anderson (inc.) | 83,739 | 62.2 | |
| Republican | Vernon E. Brown | 47,778 | 35.5 | |
| American Independent | Robert W. Copeland | 1,724 | 1.3 | |
| Peace and Freedom | Thomas E. Mathews | 1,292 | 1.0 | |
| Total votes | 134,533 | 100.0 | ||
| Turnout | ||||
| Democratic hold | ||||
1972
| Party | Candidate | Votes | % | |
|---|---|---|---|---|
| Republican | Pete McCloskey (incumbent) | 110,098 | 60.2 | |
| Democratic | James Stewart | 72,759 | 39.8 | |
| Total votes | 182,857 | 100.0 | ||
| Turnout | ||||
| Republican hold | ||||
1974
| Party | Candidate | Votes | % | |||
|---|---|---|---|---|---|---|
| Democratic | John Hans Krebs | 66,082 | 51.9 | |||
| Republican | Bob Mathias (incumbent) | 61,242 | 48.1 | |||
| Total votes | 127,324 | 100.0 | ||||
| Turnout | ||||||
| Democratic gain from Republican | ||||||
1976
| Party | Candidate | Votes | % | |
|---|---|---|---|---|
| Democratic | John Hans Krebs (incumbent) | 103,898 | 65.7 | |
| Republican | Henry J. Andreas | 54,270 | 34.3 | |
| Total votes | 158,168 | 100.0 | ||
| Turnout | ||||
| Democratic hold | ||||
1978
| Party | Candidate | Votes | % | |||
|---|---|---|---|---|---|---|
| Republican | Charles (Chip) Pashayan | 81,296 | 54.5 | |||
| Democratic | John Hans Krebs (incumbent) | 67,885 | 45.5 | |||
| Total votes | 149,181 | 100.0 | ||||
| Turnout | ||||||
| Republican gain from Democratic | ||||||
1980
| Party | Candidate | Votes | % | |
|---|---|---|---|---|
| Republican | Charles (Chip) Pashayan (inc.) | 129,159 | 70.6 | |
| Democratic | Willard H. "Bill" Johnson | 53,780 | 29.4 | |
| Total votes | 182,939 | 100.0 | ||
| Turnout | ||||
| Republican hold | ||||
1982
| Party | Candidate | Votes | % | |
|---|---|---|---|---|
| Republican | Charles (Chip) Pashayan (inc.) | 80,271 | 54 | |
| Democratic | Gene Tackett | 68,364 | 46 | |
| Total votes | 148,635 | 100 | ||
| Turnout | ||||
| Republican hold | ||||
1984
| Party | Candidate | Votes | % | |
|---|---|---|---|---|
| Republican | Charles (Chip) Pashayan (inc.) | 128,802 | 72.5 | |
| Democratic | Simon Lakritz | 48,888 | 27.5 | |
| Total votes | 177,690 | 100.0 | ||
| Turnout | ||||
| Republican hold | ||||
1986
| Party | Candidate | Votes | % | |
|---|---|---|---|---|
| Republican | Charles (Chip) Pashayan (inc.) | 88,787 | 60.2 | |
| Democratic | John Hartnett | 58,682 | 39.8 | |
| Total votes | 147,469 | 100.0 | ||
| Turnout | ||||
| Republican hold | ||||
1988
| Party | Candidate | Votes | % | |
|---|---|---|---|---|
| Republican | Charles (Chip) Pashayan (inc.) | 129,568 | 71.5 | |
| Democratic | Vincent J. Lavery | 51,730 | 28.5 | |
| Total votes | 181,298 | 100.0 | ||
| Turnout | ||||
| Republican hold | ||||
1990
| Party | Candidate | Votes | % | |||
|---|---|---|---|---|---|---|
| Democratic | Cal Dooley | 82,611 | 54.5 | |||
| Republican | Charles (Chip) Pashayan (inc.) | 68,848 | 45.5 | |||
| Total votes | 151,459 | 100.0 | ||||
| Turnout | ||||||
| Democratic gain from Republican | ||||||
1992
| Party | Candidate | Votes | % | |
|---|---|---|---|---|
| Democratic | Leon Panetta (incumbent) | 151,565 | 72.1 | |
| Republican | Bill McCampbell | 49,947 | 23.7 | |
| Peace and Freedom | Maureen Smith | 4,804 | 2.3 | |
| Libertarian | John D. Wilkes | 4,051 | 1.9 | |
| Total votes | 210,447 | 100.0 | ||
| Turnout | ||||
| Democratic hold | ||||
1993 (Special)
| Party | Candidate | Votes | % | |
|---|---|---|---|---|
| Democratic | Sam Farr | 53,675 | 52.25 | |
| Republican | Bill McCampbell | 43,774 | 42.61 | |
| American Independent | Jerome N. McCready | 1,689 | 1.64 | |
| Green | Kevin Gary Clark | 1,226 | 1.19 | |
| Libertarian | Richard J. Quigley | 948 | 0.92 | |
| Independent | Peter James | 943 | 0.92 | |
| Independent | James Ogle | 444 | 0.43 | |
| No party | Tom Shannon (write-in) | 33 | 0.03 | |
| Total votes | 102,732 | 100.00 | ||
| Turnout | ||||
| Democratic hold | ||||
1994
| Party | Candidate | Votes | % | |
|---|---|---|---|---|
| Democratic | Sam Farr (incumbent) | 87,222 | 52.17 | |
| Republican | Bill McCampbell | 74,830 | 44.49 | |
| Green | E. Craig Coffin | 5,591 | 3.34 | |
| Total votes | 167,193 | 100.0 | ||
| Turnout | ||||
| Democratic hold | ||||
1996
| Party | Candidate | Votes | % | |
|---|---|---|---|---|
| Democratic | Sam Farr (incumbent) | 115,116 | 58.9 | |
| Republican | Jess Brown | 73,856 | 37.8 | |
| Natural Law | John Black | 6,573 | 3.3 | |
| Total votes | 195,545 | 100.0 | ||
| Turnout | ||||
| Democratic hold | ||||
1998
| Party | Candidate | Votes | % | |
|---|---|---|---|---|
| Democratic | Sam Farr (incumbent) | 103,719 | 64.55 | |
| Republican | Bill McCampbell | 52,470 | 32.65 | |
| Libertarian | Rick Garrett | 2,791 | 1.74 | |
| Natural Law | Scott R. Hartley | 1,710 | 1.06 | |
| Total votes | 160,690 | 100.0 | ||
| Turnout | ||||
| Democratic hold | ||||
2000
| Party | Candidate | Votes | % | |
|---|---|---|---|---|
| Democratic | Sam Farr (incumbent) | 143,219 | 68.7 | |
| Republican | Clint Engler | 51,557 | 24.7 | |
| Green | E. Craig Coffin | 8,215 | 4.0 | |
| Libertarian | Rick S. Garrett | 2,510 | 1.2 | |
| Reform | Larry Fenton | 2,263 | 1.0 | |
| Natural Law | Scott R. Hartley | 996 | 0.4 | |
| Total votes | 208,760 | 100.0 | ||
| Turnout | ||||
| Democratic hold | ||||
2002
| Party | Candidate | Votes | % | |
|---|---|---|---|---|
| Democratic | Sam Farr (incumbent) | 101,632 | 68.1 | |
| Republican | Clint Engler | 40,334 | 27.1 | |
| Green | Ray Glock-Grueneich | 4,885 | 3.2 | |
| Libertarian | Jascha Lee | 2,418 | 1.6 | |
| No party | Alan Shugart (write-in) | 27 | 0.0 | |
| Turnout | 149,296 | |||
| Democratic hold | ||||
2004
| Party | Candidate | Votes | % | |
|---|---|---|---|---|
| Democratic | Sam Farr (incumbent) | 148,958 | 66.8 | |
| Republican | Mark Risley | 65,117 | 29.2 | |
| Green | Ray Glock-Grueneich | 3,645 | 1.7 | |
| Peace and Freedom | Joe Williams | 2,823 | 1.2 | |
| Libertarian | Joel Smolen | 2,607 | 1.1 | |
| No party | David Mauricio Munoz (write-in) | 75 | 0.0 | |
| Turnout | 282,941 | |||
| Democratic hold | ||||
2006
| Party | Candidate | Votes | % | |
|---|---|---|---|---|
| Democratic | Sam Farr (incumbent) | 120,750 | 75.9 | |
| Republican | Anthony R. DeMaio | 35,932 | 22.5 | |
| No party | Jeff Edward Taylor (write-in) | 2,611 | 1.6 | |
| Total votes | 163,293 | 100.0 | ||
| Turnout | ||||
| Democratic hold | ||||
2008
| Party | Candidate | Votes | % | |
|---|---|---|---|---|
| Democratic | Sam Farr (incumbent) | 168,907 | 73.9 | |
| Republican | Jeff Taylor | 59,037 | 25.9 | |
| independent (politician) | Peter Andresen (write-in) | 682 | 0.2 | |
| Total votes | 228,626 | 100.0 | ||
| Turnout | ||||
| Democratic hold | ||||
2010
| Party | Candidate | Votes | % | |
|---|---|---|---|---|
| Democratic | Sam Farr (incumbent) | 118,734 | 66.69 | |
| Republican | Jeff Taylor | 47,133 | 26.47 | |
| Libertarian | Mary V. Larkin | 8,753 | 4.92 | |
| Green | Eric Petersen | 3,429 | 1.93 | |
| Total votes | 178,049 | 100.00 | ||
| Turnout | ||||
| Democratic hold | ||||
2012
| Party | Candidate | Votes | % | |
|---|---|---|---|---|
| Democratic | Mike Honda (incumbent) | 159,392 | 73.5 | |
| Republican | Evelyn Li | 57,336 | 26.5 | |
| Total votes | 216,728 | 100.0 | ||
| Democratic hold | ||||
2014
| Party | Candidate | Votes | % | |
|---|---|---|---|---|
| Democratic | Mike Honda (incumbent) | 69,561 | 52% | |
| Democratic | Ro Khanna | 64,847 | 48% | |
| Total votes | 134,378 | 100.0% | ||
| Democratic hold | ||||
2016
| Party | Candidate | Votes | % | |
|---|---|---|---|---|
| Democratic | Ro Khanna | 142,268 | 61% | |
| Democratic | Mike Honda (incumbent) | 90,924 | 39% | |
| Total votes | 233,192 | 100.0% | ||
| Democratic hold | ||||
2018
| Party | Candidate | Votes | % | |
|---|---|---|---|---|
| Democratic | Ro Khanna | 159,105 | 75.3% | |
| Republican | Ron Cohen | 52,057 | 24.7% | |
| Total votes | 211,162 | 100.0% | ||
| Democratic hold | ||||
2020
| Party | Candidate | Votes | % | |
|---|---|---|---|---|
| Democratic | Ro Khanna (incumbent) | 212,137 | 71.3 | |
| Republican | Ritesh Tandon | 85,199 | 28.7 | |
| Total votes | 297,336 | 100.0 | ||
| Democratic hold | ||||
Historical district boundaries
See also
- List of United States congressional districts
References
- "My Congressional District".
- "Partisan Voting Index – Districts of the 115th Congress" (PDF). The Cook Political Report. April 7, 2017. Retrieved April 7, 2017.
- https://elections.cdn.sos.ca.gov/sov/1994-general/ssov/governor-congress-district.pdf [bare URL PDF]
- https://elections.cdn.sos.ca.gov/sov/1994-general/ssov/us-senate-congress-district.pdf [bare URL PDF]
- https://elections.cdn.sos.ca.gov/sov/1996-general/ssov/president-congress-district.pdf [bare URL PDF]
- "Archived copy" (PDF). www.sos.ca.gov. Archived from the original (PDF) on September 29, 2011. Retrieved January 11, 2022.
{{cite web}}: CS1 maint: archived copy as title (link) - "Archived copy" (PDF). www.sos.ca.gov. Archived from the original (PDF) on September 29, 2011. Retrieved January 11, 2022.
{{cite web}}: CS1 maint: archived copy as title (link) - "Statement of Vote (2000 President)" (PDF). Archived from the original (PDF) on May 20, 2011. Retrieved September 17, 2008.
- "Statement of Vote (2000 Senator)" (PDF). Archived from the original (PDF) on May 20, 2011. Retrieved September 17, 2008.
- Statement of Vote (2002 Governor) Archived November 11, 2010, at the Wayback Machine
- "Statement of Vote (2003 Recall Question)" (PDF). Archived from the original (PDF) on May 20, 2011. Retrieved October 8, 2007.
- "Statement of Vote (2003 Governor)" (PDF). Archived from the original (PDF) on May 20, 2011. Retrieved October 8, 2007.
- "Statement of Vote (2004 President)" (PDF). Archived from the original (PDF) on May 20, 2011. Retrieved August 8, 2007.
- Statement of Vote (2004 Senator) Archived August 10, 2011, at the Wayback Machine
- Statement of Vote (2006 Governor) Archived August 10, 2011, at the Wayback Machine
- Statement of Vote (2006 Senator) Archived August 10, 2011, at the Wayback Machine
- "(2008 President)". Archived from the original on February 11, 2009. Retrieved March 5, 2009.
- "Counties by Congressional District for Recall Question" (PDF). sos.ca.gov. September 14, 2021. Retrieved May 2, 2022.
- 1932 election results
- 1934 election results
- 1936 election results
- 1938 election results
- 1940 election results
- 1942 special election results
- 1942 election results
- 1944 election results
- 1946 election results
- 1948 election results
- 1950 election results
- 1952 election results
- 1954 election results
- 1956 election results
- 1958 election results
- 1960 election results
- 1962 election results
- 1964 election results
- 1966 election results
- 1968 election results
- 1970 election results
- 1972 election results
- 1974 election results
- 1976 election results
- 1978 election results
- 1980 election results
- 1982 election results
- 1984 election results
- 1986 election results
- 1988 election results
- 1990 election results
- 1992 election results
- 1993 special election results
- 1994 election results
- 1996 election results
- 1998 election results
- 2000 election results
- 2002 general election results Archived February 3, 2009, at the Wayback Machine
- 2004 general election results Archived August 21, 2008, at the Wayback Machine
- 2006 general election results Archived November 27, 2008, at the Wayback Machine
- Office of the California Secretary of State Archived December 21, 2008, at the Wayback Machine "United States Representative by District," (retrieved on August 8, 2009).
- Office of the California Secretary of State[permanent dead link] "United States Representative by District," (retrieved on March 24, 2011).
- 2012 general election results Archived October 19, 2013, at the Wayback Machine
- "U.S. House of Representatives District 17 - Districtwide Results". Archived from the original on December 21, 2014. Retrieved December 21, 2014.
External links
- GovTrack.us: California's 17th congressional district
- RAND California Election Returns: District Definitions
- California Voter Foundation map - CD17
Другой контент может иметь иную лицензию. Перед использованием материалов сайта WikiSort.org внимательно изучите правила лицензирования конкретных элементов наполнения сайта.
WikiSort.org - проект по пересортировке и дополнению контента Википедии