world.wikisort.org - USA
California's 12th congressional district is a congressional district in northern California. Speaker of the United States House of Representatives Nancy Pelosi, a Democrat, has represented the district since January 2013. She has represented various congressional districts within the city of San Francisco since 1987. The district was also once represented by Richard Nixon, at a time when the district encompassed Pasadena, Pomona, and Whittier.
| California's 12th congressional district | |||
|---|---|---|---|
Interactive map of district boundaries since 2023 (Used in the 2022 elections) | |||
| Representative |
| ||
| Distribution |
| ||
| Population (2021) | 718,792 | ||
| Median household income | $121,274 | ||
| Ethnicity |
| ||
| Cook PVI | D+38[1] | ||
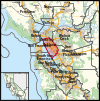


Currently, the 12th district is located in Alameda County and includes the cities of Oakland, Berkeley, Emeryville, Alameda, Albany, Piedmont, San Leandro and most of San Lorenzo. The 12th district is the most Democratic district in the United States, giving nearly 90% of its vote to Democrats in both the 2016 and 2020 presidential elections.[2]
Prior to redistricting in 2021 the 12th district was entirely within San Francisco, encompassing most of the city.[3] The remainder of the city was included in the 14th district.
History
When the district was created after the 1930 census, it was located in Los Angeles County. As California's population grew, however, the district generally was moved northward, eventually to the San Francisco peninsula.[4]
Richard Nixon, who would subsequently serve as the 37th president of the United States, represented this district from 1947 to 1951. Nancy Pelosi, the current speaker of the House, is the current representative of the district. She had previously served California's 8th congressional district from 1993 to 2013.
Recent election results from statewide races
| Year | Office | |||
|---|---|---|---|---|
| U.S. President | U.S. Senator (Class 1) |
U.S. Senator (Class 3) |
Governor of California | |
| 1992 | B. Clinton 58 – 27% | Feinstein 70 – 26% | Boxer 62 – 31% | — |
| 1994 | — | Feinstein 67 – 27% | — | Brown 53 – 44% |
| 1996 | B. Clinton 70 – 21% | — | — | — |
| 1998 | — | — | Boxer 65 – 33%[5] | Davis 71 – 26%[6] |
| 2000 | Gore 67 – 27%[7] | Feinstein 68 – 25%[8] | — | — |
| 2002 | — | — | — | Davis 60 – 27%[9] |
| 2003 | — | — | — | Recall: |
| Recall: Bustamante 47 – 32%[11] | ||||
| 2004 | Kerry 72 – 27%[12] | — | Boxer 73 – 24%[13] | — |
| 2006 | — | Feinstein 77 – 18%[14] | — | Angelides 51 – 44%[15] |
| 2008 | Obama 74 – 24%[16] | — | — | — |
| 2010 | — | — | Boxer 68 – 28% | Brown 68 – 29% |
| 2012 | Obama 84 – 13%[17] | Feinstein 89 – 11%[18] | — | — |
| 2014 | — | — | — | Brown 89 – 11%[19] |
| 2016 | Clinton 86 – 9%[20] | — | Harris 78 – 22%[21] | — |
| 2018 | — | Feinstein 64 – 36%[22] | — | Newsom 87 – 13%[23] |
| 2020 | Biden 86 – 12%[24] | — | — | — |
| 2021 | — | — | — | Recall: |
Composition
| # | County | Seat | Population |
|---|---|---|---|
| 3 | Alpine | Markleeville | 1,235 |
| 27 | Inyo | Independence | 18,970 |
Due to the 2020 redistricting, California's 12th district has effectively been shifted to the former geography of the 13th district. It encompasses the coastal section of Alameda, and is anchored by Oakland. This district borders the 13th district, and Alameda County is partitioned between them by Grant Ave, Union Pacific, Lewelling Blvd, Wicks Blvd, Manor Blvd, Juniper St, Dayton Ave, Padre Ave, Fargo Ave, Edgemoor St, Trojan Ave, Beatty St, Fleming St, Highway 880, Floresta Blvd, Halcyon Dr, Hesperian Blvd, Thornally Dr, Highway 185, 150th Ave, Highway 580, Benedict Dr, San Leandro Creek, and Lake Chabot Regional Park. Alongside Oakland, the 12th district takes in the cities of Alameda, Albany, Berkeley, Emeryville, Piedmont, and San Leandro.
Cities
- Oakland - 440,646
- Berkeley - 124,321
- San Leandro - 91,008
- Alameda - 77,624
- Albany - 20,271
- Emeryville - 12,905
- Piedmont - 11,270
List of members representing the district
| Representative | Party | Dates | Cong ress(es) |
Electoral history | Counties[26][27][28] |
|---|---|---|---|---|---|
| District created March 4, 1933 | |||||
 John H. Hoeppel |
Democratic | March 4, 1933 – January 3, 1937 |
73rd 74th |
Elected in 1932. Re-elected in 1934. Lost renomination. |
1933–1953: Eastern Los Angeles (Pasadena, Pomona, Whittier) |
 Jerry Voorhis |
Democratic | January 3, 1937 – January 3, 1947 |
75th 76th 77th 78th 79th |
Elected in 1936. Re-elected in 1938. Re-elected in 1940. Re-elected in 1942. Re-elected in 1944. Lost re-election. | |
 Richard Nixon |
Republican | January 3, 1947 – November 30, 1950 |
80th 81st |
Elected in 1946. Re-elected in 1948. Retired to run for U.S. Senator. Resigned when appointed U.S. Senator. | |
| Vacant | November 30, 1950 – January 3, 1951 |
81st | |||
 Patrick J. Hillings |
Republican | January 3, 1951 – January 3, 1953 |
82nd | Elected in 1950. Redistricted to the 25th district. | |
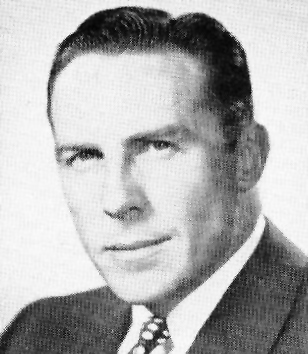
 Allan O. Hunter |
Republican | January 3, 1953 – January 3, 1955 |
83rd | Redistricted from the 9th district and re-elected in 1952. Lost re-election. |
1953–1963: Fresno, Madera, Merced |
 B. F. Sisk |
Democratic | January 3, 1955 – January 3, 1963 |
84th 85th 86th 87th |
Elected in 1954. Re-elected in 1956. Redistricted to the 16th district. | |
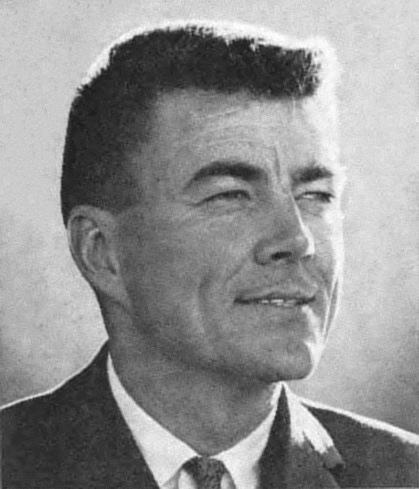
 Burt Talcott |
Republican | January 3, 1963 – January 3, 1975 |
88th 89th 90th 91st 92nd 93rd |
Elected in 1962. Re-elected in 1964. Re-elected in 1966. Re-elected in 1968. Re-elected in 1970. Re-elected in 1972. Redistricted to the 16th district. |
1963–1967: Monterey, San Benito, San Luis Obispo, Santa Cruz |
| 1967–1973: Kings, Monterey, San Luis Obispo, Santa Cruz | |||||
| 1973–1975: Monterey, San Benito, northwestern San Luis Obispo, southern Santa Clara, Santa Cruz | |||||
 Pete McCloskey |
Republican | January 3, 1975 – January 3, 1983 |
94th 95th 96th 97th |
Redistricted from the 17th district and re-elected in 1974. Re-elected in 1976. Re-elected in 1978. Re-elected in 1980. Retired to run for U.S. Senator. |
1975–1983: Southern San Mateo, northern Santa Clara |
 Ed Zschau |
Republican | January 3, 1983 – January 3, 1987 |
98th 99th |
Elected in 1982. Re-elected in 1984. Retired to run for U.S. Senator. |
1983–1993: Southern San Mateo, Santa Clara, northern Santa Cruz |
 Ernie Konnyu |
Republican | January 3, 1987 – January 3, 1989 |
100th | Elected in 1986. Lost renomination. | |
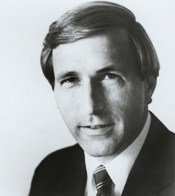
 Tom Campbell |
Republican | January 3, 1989 – January 3, 1993 |
101st 102nd |
Elected in 1988. Re-elected in 1990. Retired to run for U.S. Senator. | |
 Tom Lantos |
Democratic | January 3, 1993 – February 11, 2008 |
103rd 104th 105th 106th 107th 108th 109th 110th |
Redistricted from the 11th district and re-elected in 1992. Re-elected in 1994. Re-elected in 1996. Re-elected in 1998. Re-elected in 2000. Re-elected in 2002. Re-elected in 2004. Re-elected in 2006. Announced retirement, then died. |
1993–2003: Southwestern San Francisco, northern San Mateo |
| 2003–2013: Southwestern San Francisco, northern San Mateo  | |||||
| Vacant | February 11, 2008 – April 8, 2008 |
110th | |||
 Jackie Speier |
Democratic | April 8, 2008 – January 3, 2013 |
110th 111th 112th |
Elected to finish Lantos's term. Re-elected in 2008. Re-elected in 2010. Redistricted to the 14th district. | |
 Nancy Pelosi |
Democratic | January 3, 2013 – present |
113th 114th 115th 116th 117th |
Redistricted from the 8th district and re-elected in 2012. Re-elected in 2014. Re-elected in 2016. Re-elected in 2018. Re-elected in 2020. Redistricted to the 11th district. |
2013–present: Most of San Francisco  |
 Barbara Lee |
Democratic | January 3, 2023 – |
Redistricted from the 13th district and re-elected in 2022. | 2023–present: northwestern portion of Alameda County | |
Election results
1932
| Party | Candidate | Votes | % | ||
|---|---|---|---|---|---|
| Democratic | John H. Hoeppel | 43,122 | 45.8% | ||
| Republican | Frederick F. Houser | 40,674 | 43.2% | ||
| Prohibition | Richard M. Cannon | 10,308 | 11.0% | ||
| Total votes | 94,104 | 100.0% | |||
| Turnout | |||||
| Democratic win (new seat) | |||||
1934
| Party | Candidate | Votes | % | |
|---|---|---|---|---|
| Democratic | John H. Hoeppel (Incumbent) | 52,595 | 50.7% | |
| Republican | Frederick F. Houser | 51,216 | 49.3% | |
| Total votes | 103,811 | 100.0% | ||
| Turnout | ||||
| Democratic hold | ||||
1936
| Party | Candidate | Votes | % | |
|---|---|---|---|---|
| Democratic | Jerry Voorhis | 62,034 | 53.7% | |
| Republican | Frederick F. Houser | 53,445 | 46.3% | |
| Total votes | 115,479 | 100.0% | ||
| Turnout | ||||
| Democratic hold | ||||
1938
| Party | Candidate | Votes | % | |
|---|---|---|---|---|
| Democratic | Jerry Voorhis (Incumbent) | 75,003 | 60.8% | |
| Republican | Eugene W. Nixon | 40,457 | 32.8% | |
| Townsend | Russell R. Hand | 7,903 | 6.4% | |
| Total votes | 123,363 | 100.0% | ||
| Turnout | ||||
| Democratic hold | ||||
1940
| Party | Candidate | Votes | % | |
|---|---|---|---|---|
| Democratic | Jerry Voorhis (Incumbent) | 99,494 | 64.0% | |
| Republican | Eugene W. Nixon | 54,731 | 35.2% | |
| Communist | Albert Lewis | 1,152 | 0.8% | |
| Total votes | 155,377 | 100.0% | ||
| Turnout | ||||
| Democratic hold | ||||
1942
| Party | Candidate | Votes | % | |
|---|---|---|---|---|
| Democratic | Jerry Voorhis (Incumbent) | 53,705 | 56.8% | |
| Republican | Robert P. Shuler | 40,780 | 43.2% | |
| Total votes | 94,485 | 100.0% | ||
| Turnout | ||||
| Democratic hold | ||||
1944
| Party | Candidate | Votes | % | |
|---|---|---|---|---|
| Democratic | Jerry Voorhis (Incumbent) | 77,385 | 55.3% | |
| Republican | Roy P. McLaughlin | 62,524 | 44.7% | |
| Total votes | 139,909 | 100.0% | ||
| Turnout | ||||
| Democratic hold | ||||
1946
| Party | Candidate | Votes | % | |||
|---|---|---|---|---|---|---|
| Republican | Richard Nixon | 65,586 | 56.0% | |||
| Democratic | Jerry Voorhis (Incumbent) | 49,994 | 42.7% | |||
| Prohibition | John Henry Hoeppel | 1,476 | 1.3% | |||
| Total votes | 117,056 | 100.0% | ||||
| Turnout | ||||||
| Republican gain from Democratic | ||||||
1948
| Party | Candidate | Votes | % | |
|---|---|---|---|---|
| Republican | Richard Nixon (Incumbent) | 141,509 | 87.8% | |
| Progressive | Una W. Rice | 19,631 | 12.2% | |
| Total votes | 161,140 | 100.0% | ||
| Turnout | ||||
| Republican hold | ||||
1950
| Party | Candidate | Votes | % | |
|---|---|---|---|---|
| Republican | Patrick J. Hillings | 107,933 | 60.1% | |
| Democratic | Steve Zetterberg | 71,682 | 39.9% | |
| Total votes | 179,615 | 100.0% | ||
| Turnout | ||||
| Republican hold | ||||
1952
| Party | Candidate | Votes | % | |
|---|---|---|---|---|
| Republican | Allan O. Hunter (Incumbent) | 103,587 | 100.0% | |
| Turnout | ||||
| Republican hold | ||||
1954
| Party | Candidate | Votes | % | |||
|---|---|---|---|---|---|---|
| Democratic | B. F. Sisk | 63,911 | 53.8% | |||
| Republican | Allan O. Hunter (Incumbent) | 54,903 | 46.2% | |||
| Total votes | 118,814 | 100.0% | ||||
| Turnout | ||||||
| Democratic gain from Republican | ||||||
1956
| Party | Candidate | Votes | % | |
|---|---|---|---|---|
| Democratic | B. F. Sisk (Incumbent) | 109,920 | 73% | |
| Republican | Robert B. Moore | 40,663 | 27% | |
| Total votes | 150,583 | 100% | ||
| Turnout | ||||
| Democratic hold | ||||
1958
| Party | Candidate | Votes | % | |
|---|---|---|---|---|
| Democratic | B. F. Sisk (Incumbent) | 112,702 | 81.1% | |
| Republican | Daniel K. Halpin | 26,228 | 18.9% | |
| Total votes | 138,930 | 100% | ||
| Turnout | ||||
| Democratic hold | ||||
1960
| Party | Candidate | Votes | % | |
|---|---|---|---|---|
| Democratic | B. F. Sisk (Incumbent) | 141,974 | 100.0% | |
| Turnout | ||||
| Democratic hold | ||||
1962
| Party | Candidate | Votes | % | ||
|---|---|---|---|---|---|
| Republican | Burt Talcott (Incumbent) | 75,424 | 61.3% | ||
| Democratic | William K. Steward | 47,576 | 38.7% | ||
| Total votes | 123,000 | 100.0% | |||
| Turnout | |||||
| Republican win (new seat) | |||||
1964
| Party | Candidate | Votes | % | |
|---|---|---|---|---|
| Republican | Burt Talcott (Incumbent) | 93,112 | 61.9% | |
| Democratic | William K. Steward | 57,242 | 38.1% | |
| Total votes | 150,354 | 100.0% | ||
| Turnout | ||||
| Republican hold | ||||
1966
| Party | Candidate | Votes | % | |
|---|---|---|---|---|
| Republican | Burt Talcott (Incumbent) | 108,070 | 77.3% | |
| Democratic | Gerald V. Barron | 31,787 | 22.7% | |
| Total votes | 139,857 | 100.0% | ||
| Turnout | ||||
| Republican hold | ||||
1968
| Party | Candidate | Votes | % | |
|---|---|---|---|---|
| Republican | Burt Talcott (Incumbent) | 140,713 | 94.9% | |
| American Independent | Ann J. Holliday | 7,593 | 5.1% | |
| Total votes | 148,308 | 100.0% | ||
| Turnout | ||||
| Republican hold | ||||
1970
| Party | Candidate | Votes | % | |
|---|---|---|---|---|
| Republican | Burt Talcott (Incumbent) | 95,549 | 63.6% | |
| Democratic | O'Brien Riordan | 50,942 | 33.9% | |
| Peace and Freedom | Herbert H. Foster Jr. | 3,682 | 2.5% | |
| Total votes | 150,173 | 100.0% | ||
| Turnout | ||||
| Republican hold | ||||
1972
| Party | Candidate | Votes | % | |
|---|---|---|---|---|
| Republican | Burt Talcott (Incumbent) | 105,555 | 54.0% | |
| Democratic | Julian Camacho | 84,268 | 43.1% | |
| American Independent | Stanley K. Monteith | 5,753 | 2.9% | |
| Total votes | 195,576 | 100.0% | ||
| Turnout | ||||
| Republican hold | ||||
1974
| Party | Candidate | Votes | % | |
|---|---|---|---|---|
| Republican | Pete McCloskey (Incumbent) | 103,228 | 69.1% | |
| Democratic | Gary G. Gillmor | 46,197 | 30.9% | |
| Total votes | 149,425 | 100.0% | ||
| Turnout | ||||
| Republican hold | ||||
1976
| Party | Candidate | Votes | % | |
|---|---|---|---|---|
| Republican | Pete McCloskey (Incumbent) | 130,332 | 66.2% | |
| Democratic | David T. Harris | 61,526 | 31.3% | |
| American Independent | Joseph David "Joss" Cooney | 4,999 | 2.5% | |
| Total votes | 196,857 | 100.0% | ||
| Turnout | ||||
| Republican hold | ||||
1978
| Party | Candidate | Votes | % | |
|---|---|---|---|---|
| Republican | Pete McCloskey (Incumbent) | 116,982 | 73.1% | |
| Democratic | Kirsten Olsen | 34,472 | 21.5% | |
| American Independent | Harold R. Boylan | 5,609 | 3.5% | |
| Peace and Freedom | Adele Fumino | 3,022 | 1.9% | |
| Total votes | 160,085 | 100.0% | ||
| Turnout | ||||
| Republican hold | ||||
1980
| Party | Candidate | Votes | % | |
|---|---|---|---|---|
| Republican | Pete McCloskey (Incumbent) | 143,817 | 72.2% | |
| Democratic | Kirsten Olsen | 37,009 | 18.6% | |
| Libertarian | Bill Evers | 15,073 | 7.6% | |
| Peace and Freedom | Adele Fumino | 3,184 | 1.6% | |
| Total votes | 199,083 | 100.0% | ||
| Turnout | ||||
| Republican hold | ||||
1982
| Party | Candidate | Votes | % | |
|---|---|---|---|---|
| Republican | Ed Zschau | 115,365 | 63.0% | |
| Democratic | Emmett Lynch | 61,372 | 33.5% | |
| Libertarian | William C. "Bill" White | 6,471 | 3.5% | |
| Total votes | 183,208 | 100.0% | ||
| Turnout | ||||
| Republican hold | ||||
1984
| Party | Candidate | Votes | % | |
|---|---|---|---|---|
| Republican | Ed Zschau (Incumbent) | 155,795 | 61.7% | |
| Democratic | Martin Carnoy | 91,026 | 36.0% | |
| Libertarian | William C. "Bill" White | 5,872 | 2.3% | |
| Total votes | 252,963 | 100.0% | ||
| Turnout | ||||
| Republican hold | ||||
1986
| Party | Candidate | Votes | % | |
|---|---|---|---|---|
| Republican | Ernie Konnyu | 111,252 | 59.5% | |
| Democratic | Lance T. Weil | 69,564 | 37.2% | |
| Libertarian | William C. "Bill" White | 6,227 | 3.3% | |
| Total votes | 187,043 | 100.0% | ||
| Turnout | ||||
| Republican hold | ||||
1988
| Party | Candidate | Votes | % | |
|---|---|---|---|---|
| Republican | Tom Campbell | 136,384 | 51.7% | |
| Democratic | Anna Eshoo | 121,523 | 46.0% | |
| Libertarian | Tom Grey | 6,023 | 2.3% | |
| Total votes | 263,930 | 100.0% | ||
| Turnout | ||||
| Republican hold | ||||
1990
| Party | Candidate | Votes | % | |
|---|---|---|---|---|
| Republican | Tom Campbell (Incumbent) | 125,157 | 60.8% | |
| Democratic | Bob Palmer | 69,270 | 33.7% | |
| Libertarian | Chuck Olson | 11,271 | 5.5% | |
| Total votes | 205,698 | 100.0% | ||
| Turnout | ||||
| Republican hold | ||||
1992
| Party | Candidate | Votes | % | |||
|---|---|---|---|---|---|---|
| Democratic | Tom Lantos | 157,205 | 68.8% | |||
| Republican | Jim R. Tomlin | 53,278 | 23.3% | |||
| Peace and Freedom | Mary Weldon | 10,142 | 4.4% | |||
| Libertarian | George L. O'Brien | 7,782 | 3.4% | |||
| Total votes | 228,407 | 100.0% | ||||
| Turnout | ||||||
| Democratic gain from Republican | ||||||
1994
| Party | Candidate | Votes | % | |
|---|---|---|---|---|
| Democratic | Tom Lantos (Incumbent) | 118,408 | 67.42% | |
| Republican | Deborah Wilder | 57,228 | 32.58% | |
| Total votes | 175,636 | 100.0% | ||
| Turnout | ||||
| Democratic hold | ||||
1996
| Party | Candidate | Votes | % | |
|---|---|---|---|---|
| Democratic | Tom Lantos (Incumbent) | 149,052 | 71.7% | |
| Republican | Storm Jenkins | 49,278 | 23.8% | |
| Libertarian | Christopher Schmidt | 6,111 | 2.9% | |
| Natural Law | Richard Bong | 3,472 | 1.6% | |
| Total votes | 207,913 | 100.0% | ||
| Turnout | ||||
| Democratic hold | ||||
1998
| Party | Candidate | Votes | % | |
|---|---|---|---|---|
| Democratic | Tom Lantos (Incumbent) | 128,135 | 73.98% | |
| Republican | Robert H. Evans Jr. | 36,562 | 21.11% | |
| Libertarian | Michael J. Moloney | 8,515 | 4.92% | |
| Total votes | 173,212 | 100.0% | ||
| Turnout | ||||
| Democratic hold | ||||
2000
| Party | Candidate | Votes | % | |
|---|---|---|---|---|
| Democratic | Tom Lantos (Incumbent) | 158,404 | 74.6% | |
| Republican | Mike Garza | 44,162 | 20.8% | |
| Libertarian | Barbara J. Less | 6,431 | 3.0% | |
| Natural Law | Rifkin Young | 3,559 | 1.6% | |
| Total votes | 212,556 | 100.0% | ||
| Turnout | ||||
| Democratic hold | ||||
2002
| Party | Candidate | Votes | % | |
|---|---|---|---|---|
| Democratic | Tom Lantos (Incumbent) | 105,597 | 68.1% | |
| Republican | Michael J. Moloney | 38,381 | 24.8% | |
| Libertarian | Maad Abu-Ghazalah | 11,006 | 7.1% | |
| Total votes | 185,216 | 100.0% | ||
| Turnout | ||||
| Democratic hold | ||||
2004
| Party | Candidate | Votes | % | |
|---|---|---|---|---|
| Democratic | Tom Lantos (Incumbent) | 171,852 | 68.1% | |
| Republican | Mike Garza | 52,593 | 20.8% | |
| Green | Pat Green | 23,038 | 9.1% | |
| Libertarian | Harland Harrison | 5,116 | 2.0% | |
| Total votes | 252,599 | 100.0% | ||
| Turnout | ||||
| Democratic hold | ||||
2006
| Party | Candidate | Votes | % | |
|---|---|---|---|---|
| Democratic | Tom Lantos (Incumbent) | 138,650 | 76.1% | |
| Republican | Mike Moloney | 43,674 | 23.9% | |
| Total votes | 182,324 | 100.0% | ||
| Turnout | ||||
| Democratic hold | ||||
2008 (Special)
| Party | Candidate | Votes | % | |
|---|---|---|---|---|
| Democratic | Jackie Speier | 66,279 | 76.90% | |
| Republican | Greg Conlon | 7,990 | 9.27% | |
| Democratic | Michelle McMurry | 4,546 | 5.27% | |
| Republican | Mike Moloney | 4,517 | 5.24% | |
| Green | Barry Hermanson | 1,947 | 2.26% | |
| Libertarian | Kevin Peterson (write-in) | 2 | 0.00% | |
| Invalid or blank votes | 903 | 1.05% | ||
| Total votes | 86,184 | 100.00% | ||
| Turnout | 25.69% | |||
| Democratic hold | ||||
2008
| Party | Candidate | Votes | % | |
|---|---|---|---|---|
| Democratic | Jackie Speier (Incumbent) | 200,442 | 75.2% | |
| Republican | Greg Conlon | 49,258 | 18.5% | |
| Peace and Freedom | Nathalie Hrizi | 5,793 | 2.2% | |
| Green | Barry Hermanson | 5,776 | 2.1% | |
| Libertarian | Kevin Dempsey Peterson | 5,584 | 2.0% | |
| Total votes | 266,853 | 100% | ||
| Turnout | ||||
| Democratic hold | ||||
2010
| Party | Candidate | Votes | % | |
|---|---|---|---|---|
| Democratic | Jackie Speier (Incumbent) | 152,044 | 75.6% | |
| Republican | Mike Moloney | 44,475 | 22.2% | |
| Libertarian | Mark Paul Williams | 4,611 | 2.2% | |
| Independent | Joseph Michael Harding (write-in) | 32 | 0.0% | |
| Total votes | 201,162 | 100% | ||
| Turnout | ||||
| Democratic hold | ||||
2012
| Party | Candidate | Votes | % | |
|---|---|---|---|---|
| Democratic | Nancy Pelosi | 253,709 | 85.1% | |
| Republican | John Dennis | 44,478 | 14.9% | |
| Total votes | 298,187 | 100.0% | ||
| Democratic hold | ||||
2014
| Party | Candidate | Votes | % | |
|---|---|---|---|---|
| Democratic | Nancy Pelosi (Incumbent) | 160,067 | 83.3% | |
| Republican | John Dennis | 32,197 | 16.7% | |
| Total votes | 192,264 | 100.0% | ||
| Democratic hold | ||||
2016
| Party | Candidate | Votes | % | |
|---|---|---|---|---|
| Democratic | Nancy Pelosi (Incumbent) | 274,035 | 80.9% | |
| Independent | Preston Picus | 64,810 | 19.1% | |
| Total votes | 338,845 | 100% | ||
| Democratic hold | ||||
2018
| Party | Candidate | Votes | % | |
|---|---|---|---|---|
| Democratic | Nancy Pelosi (Incumbent) | 275,292 | 86.8% | |
| Republican | Lisa Remmer | 41,780 | 13.2% | |
| Total votes | 317,072 | 100% | ||
| Democratic hold | ||||
2020
| Party | Candidate | Votes | % | |
|---|---|---|---|---|
| Democratic | Nancy Pelosi (incumbent) | 281,776 | 77.6% | |
| Democratic | Shahid Buttar | 81,174 | 22.4% | |
| Total votes | 362,950 | 100% | ||
| Democratic hold | ||||
See also
- List of United States congressional districts
References
- "Introducing the 2021 Cook Political Report Partisan Voter Index". The Cook Political Report. April 15, 2021. Retrieved April 15, 2021.
- "CA 2022 Congressional". Dave's Redistricting. January 4, 2022. Retrieved November 11, 2022.
- "Maps: Final Congressional Districts". Citizens Redistricting Commission. Archived from the original on March 10, 2013. Retrieved February 24, 2013.
- California Constitution, Article 21, Section 1(c) (congressional districts), Section 2(f) (state government districts).
- "SUPPLEMENT TO THE STATEMENT OF VOTE – NOVEMBER 3, 1998 ELECTION" (PDF). September 29, 2011. Archived from the original (PDF) on September 29, 2011.
- "SUPPLEMENT TO THE STATEMENT OF VOTE – NOVEMBER 3, 1998 GENERAL ELECTION" (PDF). September 29, 2011. Archived from the original (PDF) on September 29, 2011.
- "Statement of Vote (2000 President)" (PDF). Archived from the original (PDF) on June 11, 2007. Retrieved September 17, 2008.
- "Statement of Vote (2000 Senator)" (PDF). Archived from the original (PDF) on June 11, 2007. Retrieved September 17, 2008.
- "Statement of Vote (2002 Governor)" (PDF). Archived from the original (PDF) on November 11, 2010.
- "Statement of Vote (2003 Recall Question)" (PDF). Archived from the original (PDF) on May 20, 2011. Retrieved October 8, 2007.
- "Statement of Vote (2003 Governor)" (PDF). Archived from the original (PDF) on May 20, 2011. Retrieved October 8, 2007.
- "Statement of Vote (2004 President)" (PDF). Archived from the original (PDF) on August 1, 2010. Retrieved August 8, 2007.
- "Statement of Vote (2004 Senator)" (PDF). Archived from the original (PDF) on August 10, 2011.
- "Statement of Vote (2006 Senator)" (PDF). Archived from the original (PDF) on August 10, 2011.
- "Statement of Vote (2006 Governor)" (PDF). Archived from the original (PDF) on August 10, 2011.
- "(2008 President)". Archived from the original on February 11, 2009. Retrieved March 5, 2009.
- "Daily Kos Elections' presidential results by congressional district for the 2016 and 2012 elections".
- https://elections.cdn.sos.ca.gov/sov/2012-general/ssov/us-senate-by-congress.pdf [bare URL PDF]
- https://elections.cdn.sos.ca.gov/sov/2014-general/ssov/governor-congressional.pdf [bare URL PDF]
- "2016 General Election Results | California Secretary of State". Archived from the original on November 11, 2016. Retrieved November 10, 2016.
- "2016 General Election Results | California Secretary of State". Archived from the original on November 11, 2016. Retrieved November 10, 2016.
- https://elections.cdn.sos.ca.gov/sov/2018-general/ssov/us-senate-by-congress.pdf [bare URL PDF]
- https://elections.cdn.sos.ca.gov/sov/2018-general/ssov/governor-congressional.pdf [bare URL PDF]
- Nir, David (November 19, 2020). "Daily Kos Elections' presidential results by congressional district for 2020, 2016, and 2012". Daily Kos.
- "Counties by Congressional District for Recall Question" (PDF). sos.ca.gov. September 14, 2021. Retrieved May 2, 2022.
- Martis, Kenneth C., The Historical Atlas of United States Congressional Districts, 1789–1983. New York: Macmillan Publishing, 1982.
- Martis, Kenneth C., The Historical Atlas of Political Parties in the United States Congress, 1789–1989. New York: Macmillan Publishing, 1989.
- "Congressional Directory: Browse 105th Congress". Archived from the original on February 17, 2011.
- "1932 election results" (PDF).
- "1934 election results" (PDF).
- "1936 election results" (PDF).
- "1938 election results" (PDF).
- "1940 election results" (PDF).
- "1942 election results" (PDF).
- "1944 election results" (PDF).
- "1946 election results" (PDF).
- "1948 election results" (PDF).
- "1950 election results" (PDF).
- "1952 election results" (PDF).
- "1954 election results" (PDF).
- "1956 election results" (PDF).
- "1958 election results" (PDF).
- "1960 election results" (PDF).
- "1962 election results" (PDF).
- "1964 election results" (PDF).
- "1966 election results" (PDF).
- "1968 election results" (PDF).
- "1970 election results" (PDF).
- "1972 election results" (PDF).
- "1974 election results" (PDF).
- "1976 election results" (PDF).
- "1978 election results" (PDF).
- "1980 election results" (PDF).
- "1982 election results" (PDF).
- "1984 election results" (PDF).
- "1986 election results" (PDF).
- "1988 election results" (PDF).
- "1990 election results" (PDF).
- "1992 election results" (PDF).
- "1994 election results" (PDF).
- "1996 election results" (PDF).
- "1998 election results" (PDF).
- "2000 election results" (PDF).
- "2002 general election results" (PDF). Archived from the original (PDF) on February 3, 2009.
- "2004 general election results" (PDF). Archived from the original (PDF) on August 21, 2008.
- "2006 general election results" (PDF). Archived from the original (PDF) on November 27, 2008.
- "2008 special election results" (PDF). Archived from the original (PDF) on July 3, 2008. Retrieved July 4, 2008.
- "2008 general election results" (PDF). Archived from the original (PDF) on December 21, 2008.
- "2010 general election results" (PDF). Archived from the original (PDF) on May 20, 2011. Retrieved February 21, 2011.
- "2012 general election results" (PDF). Archived from the original (PDF) on October 19, 2013.
- "2014 general election results". Archived from the original on December 21, 2014. Retrieved December 21, 2014.
- "California Election Results: 12th Congressional District". The New York Times. November 3, 2020. Retrieved January 4, 2021.
External links
- GovTrack.us: California's 12th congressional district
- RAND California Election Returns: District Definitions (out of date)
- California Voter Foundation map – CD12 (out of date)
Другой контент может иметь иную лицензию. Перед использованием материалов сайта WikiSort.org внимательно изучите правила лицензирования конкретных элементов наполнения сайта.
WikiSort.org - проект по пересортировке и дополнению контента Википедии