world.wikisort.org - United_Kingdom
Wirral West is a constituency represented in the House of Commons of the UK Parliament by Margaret Greenwood of the Labour Party since 2015.
| Wirral West | |
|---|---|
| County constituency for the House of Commons | |
 Boundary of Wirral West in Merseyside | |
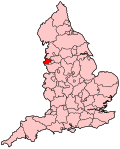 Location of Merseyside within England | |
| County | Merseyside |
| Electorate | 55,077 (December 2010)[1] |
| Major settlements | Hoylake, West Kirby |
| Current constituency | |
| Created | 1983 |
| Member of Parliament | Margaret Greenwood (Labour) |
| Number of members | One |
| Created from | Wirral |
Constituency profile
The constituency is one of four covering the Metropolitan Borough of Wirral. It includes Hoylake, West Kirby, Woodchurch and the north edge of Heswall. This is one of the more affluent areas within Merseyside,[2] reflected in higher house prices and wages than the wider North West region.[3]
History
Wirral West was created in 1983 from the northern part of the former Wirral constituency, which had traditionally elected Conservative MPs. Selwyn Lloyd was the predecessor constituency's MP from 1945 to 1976, serving as Foreign Secretary during the Eden ministry, Chancellor of the Exchequer during the Macmillan ministry and becoming Speaker of the Commons in 1971. Raised to the peerage in 1976, Lloyd resigned his seat and the ensuing by-election was won by David Hunt, who became the first MP for Wirral West in 1983. Hunt was a Cabinet member under Margaret Thatcher and John Major, serving as Secretary of State for Employment and twice as Secretary of State for Wales.
Hunt held the seat until 1997, when he lost to barrister Stephen Hesford of the Labour Party, but remained in Parliament as a member of the House of Lords. Hesford increased his majority in 2001 and narrowly retained the seat in 2005, despite a challenge at the latter election from former TV presenter and Conservative Esther McVey. On 22 January 2010, he announced his intention to step down at the next general election for family reasons.
New boundary changes implemented, McVey stood again and won the seat for the Conservatives at the 2010 general election, serving in the coalition government as a Work and Pensions minister during her tenure. If implemented in 2005, the 2010 boundary changes would have seen the Conservatives win the seat by 569 votes.
Wirral West had been described as a bellwether since its establishment,[4][5] but bucked the trend at the 2015 general election when Labour's Margaret Greenwood narrowly defeated McVey, despite the Conservatives winning a parliamentary majority. Like the nearby City of Chester, it was one of the few Conservative-held marginals outside of London to be gained by Labour, who benefited from the constituency's collapse in Liberal Democrat support.
Sixth on the Conservative target list in 2017, Greenwood was comfortably re-elected to Wirral West with the highest winning vote share since the seat was first up for election in 1983. She was promoted to Jeremy Corbyn's shadow cabinet as the Shadow Work and Pensions Secretary in 2018, shadowing McVey who had returned to Parliament as the MP for Tatton. Greenwood was re-elected with a reduced vote share in 2019, and departed from the shadow cabinet upon Keir Starmer's election as Labour leader.
Boundaries

1983–2010: Metropolitan Borough of Wirral wards of Hoylake, Prenton, Royden, Thurstaston, and Upton.
2010–present: Metropolitan Borough of Wirral wards of Greasby, Frankby and Irby, Hoylake and Meols, Pensby and Thingwall, Upton, and West Kirby and Thurstaston.
In the 2005 Boundary Commission report, Wirral West lost part of the Prenton ward to the Birkenhead constituency, and gained part of Barnston from Wirral South.
Members of Parliament
| Election | Member[6] | Party | |
|---|---|---|---|
| 1983 | David Hunt | Conservative | |
| 1997 | Stephen Hesford | Labour | |
| 2010 | Esther McVey | Conservative | |
| 2015 | Margaret Greenwood | Labour | |
Elections
Elections in the 1980s
| Party | Candidate | Votes | % | ||
|---|---|---|---|---|---|
| Conservative | David Hunt | 25,276 | 55.9 | ||
| Liberal | Stephen Mulholland | 10,125 | 22.4 | ||
| Labour | John McCabe | 9,855 | 21.8 | ||
| Majority | 15,151 | 33.5 | |||
| Turnout | 45,256 | 73.4 | |||
| Registered electors | 61,646 | ||||
| Conservative win (new seat) | |||||
| Party | Candidate | Votes | % | ±% | |
|---|---|---|---|---|---|
| Conservative | David Hunt | 25,736 | 51.9 | ||
| Labour | Alexander Dunn | 13,013 | 26.3 | ||
| Liberal | Allan Brame | 10,015 | 20.2 | ||
| Green | David Burton | 806 | 1.6 | New | |
| Majority | 12,723 | 25.6 | |||
| Turnout | 49,570 | 77.9 | |||
| Registered electors | 63,597 | ||||
| Conservative hold | Swing | ||||
Elections in the 1990s
| Party | Candidate | Votes | % | ±% | |
|---|---|---|---|---|---|
| Conservative | David Hunt | 26,852 | 52.7 | ||
| Labour | Helen Stephenson | 15,788 | 31.0 | ||
| Liberal Democrats | John Thornton | 7,420 | 14.6 | ||
| Green | Garnette Bowler | 700 | 1.4 | ||
| Natural Law | Nigel Broome | 188 | 0.4 | New | |
| Majority | 11,064 | 21.7 | |||
| Turnout | 50,948 | 81.6 | |||
| Registered electors | 62,453 | ||||
| Conservative hold | Swing | ||||
| Party | Candidate | Votes | % | ±% | |
|---|---|---|---|---|---|
| Labour | Stephen Hesford | 21,035 | 44.9 | ||
| Conservative | David Hunt | 18,297 | 39.0 | ||
| Liberal Democrats | John Thornton | 5,945 | 12.7 | ||
| Referendum | Derek Wharton | 1,613 | 3.4 | New | |
| Majority | 2,738 | 5.9 | N/A | ||
| Turnout | 46,890 | 77.0 | |||
| Registered electors | 60,908 | ||||
| Labour gain from Conservative | Swing | ||||
Elections in the 2000s
| Party | Candidate | Votes | % | ±% | |
|---|---|---|---|---|---|
| Labour | Stephen Hesford | 19,105 | 47.2 | ||
| Conservative | Chris Lynch | 15,070 | 37.2 | ||
| Liberal Democrats | Simon Holbrook | 6,300 | 15.6 | ||
| Majority | 4,035 | 10.0 | |||
| Turnout | 40,475 | 65.0 | |||
| Registered electors | 62,294 | ||||
| Labour hold | Swing | ||||
| Party | Candidate | Votes | % | ±% | |
|---|---|---|---|---|---|
| Labour | Stephen Hesford | 17,543 | 42.5 | ||
| Conservative | Esther McVey | 16,446 | 39.9 | ||
| Liberal Democrats | Jeffrey Clarke | 6,652 | 16.1 | ||
| UKIP | John Moore | 429 | 1.0 | New | |
| Alternative | Roger Taylor | 163 | 0.4 | New | |
| Majority | 1,097 | 2.6 | |||
| Turnout | 41,233 | 67.5 | |||
| Registered electors | 61,050 | ||||
| Labour hold | Swing | ||||
Elections in the 2010s
| Party | Candidate | Votes | % | ||
|---|---|---|---|---|---|
| Conservative | Esther McVey | 16,726 | 42.5 | ||
| Labour | Phil Davies | 14,290 | 36.3 | ||
| Liberal Democrats | Peter Reisdorf | 6,630 | 16.8 | ||
| UKIP | Philip Griffiths | 899 | 2.3 | ||
| Independent | David Kirwan | 506 | 1.3 | ||
| Common Sense | David James | 321 | 0.8 | ||
| Majority | 2,436 | 6.2 | |||
| Turnout | 39,372 | 71.5 | |||
| Registered electors | 55,050 | ||||
| Conservative win (new boundaries) | |||||
| Party | Candidate | Votes | % | ±% | |
|---|---|---|---|---|---|
| Labour | Margaret Greenwood | 18,898 | 45.1 | ||
| Conservative | Esther McVey | 18,481 | 44.2 | ||
| UKIP | Hilary Jones | 2,772 | 6.6 | ||
| Liberal Democrats | Peter Reisdorf | 1,433 | 3.4 | ||
| Independent | David James | 274 | 0.7 | ||
| Majority | 417 | 0.9 | N/A | ||
| Turnout | 41,858 | 75.6 | |||
| Registered electors | 55,377 | ||||
| Labour gain from Conservative | Swing | ||||
| Party | Candidate | Votes | % | ±% | |
|---|---|---|---|---|---|
| Labour | Margaret Greenwood | 23,866 | 54.3 | ||
| Conservative | Tony Caldeira | 18,501 | 42.1 | ||
| Liberal Democrats | Peter Reisdorf | 1,155 | 2.6 | ||
| Green | John Coyne | 429 | 1.0 | New | |
| Majority | 5,365 | 12.2 | |||
| Turnout | 42,951 | 78.6 | |||
| Registered electors | 55,995 | ||||
| Labour hold | Swing | ||||
| Party | Candidate | Votes | % | ±% | |
|---|---|---|---|---|---|
| Labour | Margaret Greenwood | 20,695 | 48.2 | ||
| Conservative | Laura Evans | 17,692 | 41.2 | ||
| Liberal Democrats | Andy Corkhill | 2,706 | 6.3 | ||
| Green | John Coyne | 965 | 2.2 | ||
| Brexit Party | John Kelly | 860 | 2.0 | New | |
| Majority | 3,003 | 7.0 | |||
| Turnout | 42,918 | 77.5 | |||
| Registered electors | 55,550 | ||||
| Labour hold | Swing | ||||
See also
- List of parliamentary constituencies in Merseyside
References
- "Electorate Figures – Boundary Commission for England". 2011 Electorate Figures. Boundary Commission for England. 4 March 2011. Retrieved 13 March 2011.
- UK Polling Report http://ukpollingreport.co.uk/2015guide/wirralwest/
- Electoral Calculus https://www.electoralcalculus.co.uk/fcgi-bin/seatdetails.py?seat=Wirral+West
- Joe Thomas (22 April 2015). "General election 2015: 'Kingmaker' Wirral West voters hold keys to Downing Street". Liverpool Echo. Retrieved 12 May 2015.
- Harry Lambert (20 April 2015). "What are the top seats to watch in the election?". New Statesman. Retrieved 12 May 2015.
- Leigh Rayment's Historical List of MPs – Constituencies beginning with "W" (part 4)
- "Election Data 1983". Electoral Calculus. Archived from the original on 15 October 2011. Retrieved 18 October 2015.
- "Election Data 1987". Electoral Calculus. Archived from the original on 15 October 2011. Retrieved 18 October 2015.
- "Election Data 1992". Electoral Calculus. Archived from the original on 15 October 2011. Retrieved 18 October 2015.
- "Politics Resources". Election 1992. Politics Resources. 9 April 1992. Retrieved 6 December 2010.
- "Election Data 1997". Electoral Calculus. Archived from the original on 15 October 2011. Retrieved 18 October 2015.
- "Election Data 2001". Electoral Calculus. Archived from the original on 15 October 2011. Retrieved 18 October 2015.
- "BBC NEWS | VOTE 2001 | RESULTS & CONSTITUENCIES | Wirral West". news.bbc.co.uk. Retrieved 7 June 2021.
- "Parliamentary Election results 2005 |". ww3.wirral.gov.uk. Retrieved 7 June 2021.
- "Election Result for Wirral West constituency on 6 May 2010". ww3.wirral.gov.uk. Retrieved 7 June 2021.
- "Election Result for Wirral West Constituency on 7 May 2015 | WIRRAL Borough Council". www.wirral.gov.uk. Retrieved 7 June 2021.
- "Election results for WIRRAL WEST, 8 June 2017". democracy.wirral.gov.uk. 8 June 2017. Retrieved 7 June 2021.
- "Election results for WIRRAL WEST, 12 December 2019". democracy.wirral.gov.uk. 12 December 2019. Retrieved 7 June 2021.
Constituencies in North West England (75) | |
|---|---|
| Labour (42) |
|
| Conservative (31) |
|
| Liberal Democrats (1) |
|
| Speaker (1) |
|
| |
| Authority control |
|---|
Другой контент может иметь иную лицензию. Перед использованием материалов сайта WikiSort.org внимательно изучите правила лицензирования конкретных элементов наполнения сайта.
WikiSort.org - проект по пересортировке и дополнению контента Википедии