world.wikisort.org - United_Kingdom
North East Cambridgeshire is a constituency[n 1] represented in the House of Commons of the UK Parliament since 2010 by Steve Barclay, a Conservative.[n 2]
| North East Cambridgeshire | |
|---|---|
| County constituency for the House of Commons | |
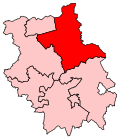 Boundary of North East Cambridgeshire in Cambridgeshire | |
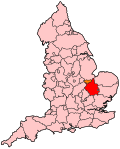 Location of Cambridgeshire within England | |
| County | Cambridgeshire |
| Electorate | 83,286 (2018)[1] |
| Major settlements | Wisbech, March, Whittlesey and Chatteris |
| Current constituency | |
| Created | 1983 |
| Member of Parliament | Steve Barclay (Conservative) |
| Number of members | One |
| Created from | Isle of Ely Peterborough[2] |
Constituency profile
This large and rural seat is in The Fens and has a significant farming and food production sector. Residents are less wealthy and healthy than the UK average.[3]
History
Clement Freud, former Liberal MP for Isle of Ely from 1973, represented the seat from its creation in 1983 until 1987, when he was defeated by the Conservative Malcolm Moss and since then it has been served by one other Conservative MP, namely Steve Barclay, first elected in 2010. On 16 November 2018, Barclay was appointed Secretary of State for Exiting the European Union.
Boundaries and boundary changes
1983–1997: The District of Fenland, the District of East Cambridgeshire wards of Downham, Haddenham, Littleport, Stretham, Sutton, and Witchford, and the City of Peterborough wards of Eye, Newborough, and Thorney.[4]
The seat was created for the 1983 general election which followed on from the merger under the Local Government Act 1972, of the two administrative counties of Huntingdon and Peterborough and Cambridgeshire and Isle of Ely to form the non-metropolitan county of Cambridgeshire, with effect from 1 April 1974. It was formed from the abolished constituency of Isle of Ely, with the exception of the city of Ely itself, which was included in the new County Constituency of South East Cambridgeshire. The three City of Peterborough wards were transferred from the Borough Constituency of Peterborough.
1997–2010: The District of Fenland, the District of East Cambridgeshire wards of Downham, Littleport, and Sutton, and the City of Peterborough wards of Eye, Newborough, and Thorney.[5]
Minor loss to South East Cambridgeshire.
2010–present: The District of Fenland, and the District of East Cambridgeshire wards of Downham Villages, Littleport East, Littleport West, and Sutton.[6]
The City of Peterborough wards were returned to the constituency thereof. No other changes.
Members of Parliament
| Election | Member[7] | Party | |
|---|---|---|---|
| Isle of Ely prior to 1983 | |||
| 1983 | Clement Freud | Liberal | |
| 1987 | Malcolm Moss | Conservative | |
| 2010 | Steve Barclay | Conservative | |
Elections
Elections in the 2010s
| Party | Candidate | Votes | % | ±% | |
|---|---|---|---|---|---|
| Conservative | Steve Barclay | 38,423 | 72.5 | +8.1 | |
| Labour | Diane Boyd | 8,430 | 15.9 | -8.6 | |
| Liberal Democrats | Rupert Moss-Eccardt | 4,298 | 8.1 | +3.6 | |
| Green | Ruth Johnson | 1,813 | 3.4 | +1.5 | |
| Majority | 29,993 | 56.6 | +16.7 | ||
| Turnout | 52,964 | 63.3 | +0.2 | ||
| Conservative hold | Swing | +8.4 | |||
| Party | Candidate | Votes | % | ±% | |
|---|---|---|---|---|---|
| Conservative | Steve Barclay | 34,340 | 64.4 | +9.3 | |
| Labour | Ken Rustidge | 13,070 | 24.5 | +10.1 | |
| Liberal Democrats | Darren Fower | 2,383 | 4.5 | 0.0 | |
| UKIP | Robin Talbot | 2,174 | 4.1 | -18.4 | |
| Green | Ruth Johnson | 1,024 | 1.9 | -1.6 | |
| English Democrat | Stephen Goldspink | 293 | 0.5 | New | |
| Majority | 21,270 | 39.9 | +7.3 | ||
| Turnout | 53,284 | 63.1 | +0.7 | ||
| Conservative hold | Swing | -0.4 | |||
| Party | Candidate | Votes | % | ±% | |
|---|---|---|---|---|---|
| Conservative | Steve Barclay | 28,524 | 55.1 | +3.7 | |
| UKIP | Andrew Charalambous | 11,650 | 22.5 | +16.8 | |
| Labour | Ken Rustidge | 7,476 | 14.4 | −3.3 | |
| Liberal Democrats | Lucy Nethsingha | 2,314 | 4.5 | −15.5 | |
| Green | Helen Scott-Daniels | 1,816 | 3.5 | New | |
| Majority | 16,874 | 32.6 | +1.2 | ||
| Turnout | 51,780 | 62.4 | -9.0 | ||
| Conservative hold | Swing | -6.8 | |||
| Party | Candidate | Votes | % | ±% | |
|---|---|---|---|---|---|
| Conservative | Steve Barclay | 26,862 | 51.4 | +4.5 | |
| Liberal Democrats | Lorna Spenceley | 10,437 | 20.0 | +2.9 | |
| Labour | Peter Roberts | 9,274 | 17.7 | −12.9 | |
| UKIP | Robin Talbot | 2,991 | 5.7 | +0.4 | |
| BNP | Susan Clapp | 1,747 | 3.3 | New | |
| Independent | Debra Jordan | 566 | 1.1 | New | |
| English Democrat | Graham Murphy | 387 | 0.7 | New | |
| Majority | 16,425 | 31.4 | +13.9 | ||
| Turnout | 52,264 | 71.4 | +12.2 | ||
| Conservative hold | Swing | +0.8 | |||
Elections in the 2000s
| Party | Candidate | Votes | % | ±% | |
|---|---|---|---|---|---|
| Conservative | Malcolm Moss | 24,181 | 47.5 | −0.6 | |
| Labour | ffinlo Costain | 15,280 | 30.0 | −4.9 | |
| Liberal Democrats | Alan Dean | 8,693 | 17.1 | +3.1 | |
| UKIP | Len Baynes | 2,723 | 5.4 | +2.9 | |
| Majority | 8,901 | 17.5 | +4.3 | ||
| Turnout | 50,877 | 59.8 | −0.3 | ||
| Conservative hold | Swing | +2.1 | |||
| Party | Candidate | Votes | % | ±% | |
|---|---|---|---|---|---|
| Conservative | Malcolm Moss | 23,132 | 48.1 | +5.1 | |
| Labour | Dil Owen | 16,759 | 34.9 | +1.1 | |
| Liberal Democrats | Richard Renaut | 6,733 | 14.0 | −2.4 | |
| UKIP | John Stevens | 1,189 | 2.5 | New | |
| ProLife Alliance | Tony Hoey | 238 | 0.5 | New | |
| Majority | 6,373 | 13.2 | +4.0 | ||
| Turnout | 48,051 | 60.1 | −12.5 | ||
| Conservative hold | Swing | +2.1 | |||
Elections in the 1990s
| Party | Candidate | Votes | % | ±% | |
|---|---|---|---|---|---|
| Conservative | Malcolm Moss | 23,855 | 43.0 | −11.0 | |
| Labour | Virginia Bucknor | 18,754 | 33.8 | +20.0 | |
| Liberal Democrats | Andrew Nash | 9,070 | 16.4 | −13.9 | |
| Referendum | Michael W. Bacon | 2,636 | 4.8 | New | |
| Socialist Labour | Chris J. Bennett | 851 | 1.5 | New | |
| Natural Law | Luke K.C. Leighton | 259 | 0.5 | +0.2 | |
| Majority | 5,101 | 9.2 | -14.5 | ||
| Turnout | 55,425 | 72.6 | −6.7 | ||
| Conservative hold | Swing | −15.5 | |||
| Party | Candidate | Votes | % | ±% | |
|---|---|---|---|---|---|
| Conservative | Malcolm Moss | 34,288 | 54.0 | +7.0 | |
| Liberal Democrats | Maurice Leeke | 19,195 | 30.3 | −14.2 | |
| Labour | Ronald Harris | 8,746 | 13.8 | +5.3 | |
| Liberal | Chris D. Ash | 998 | 1.6 | New | |
| Natural Law | Marion Chalmers | 227 | 0.3 | New | |
| Majority | 15,093 | 23.7 | +21.2 | ||
| Turnout | 63,454 | 79.3 | +1.9 | ||
| Conservative hold | Swing | +10.6 | |||
Elections in the 1980s
| Party | Candidate | Votes | % | ±% | |
|---|---|---|---|---|---|
| Conservative | Malcolm Moss | 26,983 | 47.0 | +6.2 | |
| Liberal | Clement Freud | 25,555 | 44.5 | −6.0 | |
| Labour | Ronald Harris | 4,891 | 8.5 | −0.2 | |
| Majority | 1,428 | 2.5 | N/A | ||
| Turnout | 57,429 | 77.4 | +1.1 | ||
| Conservative gain from Liberal | Swing | +6.1 | |||
| Party | Candidate | Votes | % | ±% | |
|---|---|---|---|---|---|
| Liberal | Clement Freud | 26,936 | 50.5 | ||
| Conservative | Nicholas Duval | 21,741 | 40.8 | ||
| Labour | Ronald Harris | 4,625 | 8.7 | ||
| Majority | 5,195 | 9.7 | |||
| Turnout | 53,302 | 76.3 | |||
| Liberal win (new seat) | |||||
See also
- List of parliamentary constituencies in Cambridgeshire
Notes
- A county constituency (for the purposes of election expenses and type of returning officer)
- As with all constituencies, the constituency elects one Member of Parliament (MP) by the first past the post system of election at least every five years.
References
- "England Parliamentary electorates 2010-2018". Boundary Commission for England. Retrieved 23 March 2019.
- "'Cambridgeshire North East', June 1983 up to May 1997". ElectionWeb Project. Cognitive Computing Limited. Retrieved 10 March 2016.
- Electoral Calculus https://www.electoralcalculus.co.uk/fcgi-bin/seatdetails.py?seat=Cambridgeshire+North+East
- "The Parliamentary Constituencies (England) Order 1983". www.legislation.gov.uk. Retrieved 6 March 2019.
- "The Parliamentary Constituencies (England) Order 1995". www.legislation.gov.uk. Retrieved 6 March 2019.
- "The Parliamentary Constituencies (England) Order 2007". www.legislation.gov.uk. Retrieved 6 March 2019.
- Leigh Rayment's Historical List of MPs – Constituencies beginning with "C" (part 1)
- "Cambridgeshire North East Parliamentary constituency". BBC News. BBC. Retrieved 19 November 2019.
- "Cambridgeshire North East parliamentary constituency - Election 2017" – via www.bbc.co.uk.
- "Cambridgeshire North East - Election 2015". BBC News.
- "BBC NEWS – Election 2010 – Cambridgeshire North East". BBC News.
- Cambridgeshire North East, guardian.co.uk
- "British Parliamentary Election results 1983-97: English Counties". www.election.demon.co.uk.
- "Politics Resources". Election 1992. Politics Resources. 9 April 1992. Archived from the original on 24 July 2011. Retrieved 6 December 2010.
| Authority control |
|---|
Другой контент может иметь иную лицензию. Перед использованием материалов сайта WikiSort.org внимательно изучите правила лицензирования конкретных элементов наполнения сайта.
WikiSort.org - проект по пересортировке и дополнению контента Википедии