world.wikisort.org - Germany
Reitwein is a municipality in the district Märkisch-Oderland, in Brandenburg, Germany.[3] It is located near the border with Poland.
Reitwein | |
|---|---|
Municipality | |
Location of Reitwein within Märkisch-Oderland district  | |
 Reitwein 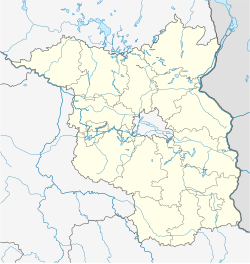 Reitwein | |
| Coordinates: 52°30′00″N 14°34′59″E | |
| Country | Germany |
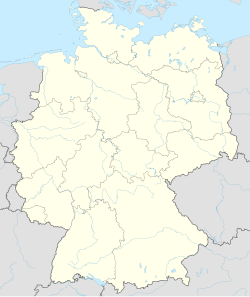
| State | Brandenburg |
| District | Märkisch-Oderland |
| Municipal assoc. | Lebus |
| Government | |
| • Mayor (2019–24) | Detlef Schieberle[1] |
| Area | |
| • Total | 23.80 km2 (9.19 sq mi) |
| Elevation | 13 m (43 ft) |
| Population (2021-12-31)[2] | |
| • Total | 449 |
| • Density | 19/km2 (49/sq mi) |
| Time zone | UTC+01:00 (CET) |
| • Summer (DST) | UTC+02:00 (CEST) |
| Postal codes | 15328 |
| Dialling codes | 033601 |
| Vehicle registration | MOL |
Demography

|
|

References
- Landkreis Märkisch-Oderland Wahl der Bürgermeisterin / des Bürgermeisters, accessed 1 July 2021.
- "Bevölkerungsentwicklung und Flächen der kreisfreien Städte, Landkreise und Gemeinden im Land Brandenburg 2021" (PDF). Amt für Statistik Berlin-Brandenburg (in German). June 2022.
- Mapa Polski 1:500 000 Wojskowy Instytut Geograficzny Sztabu Generalnego W.P., Warszawa 1947
- Detailed data sources are to be found in the Wikimedia Commons.Population Projection Brandenburg at Wikimedia Commons
External links
![]() Media related to Reitwein at Wikimedia Commons
Media related to Reitwein at Wikimedia Commons
Authority control | |
|---|---|
| General |
|
| National libraries | |
| Other |
|
This Brandenburg location article is a stub. You can help Wikipedia by expanding it. |
На других языках
[de] Reitwein
Reitwein ist eine Gemeinde im Landkreis Märkisch-Oderland (Brandenburg). Sie wird vom Amt Lebus verwaltet. Die an der Oder verlaufende östliche Gemeindegrenze bildet gleichzeitig die deutsche Grenze zur Republik Polen.- [en] Reitwein
[ru] Райтвайн
Райтвайн (нем. Reitwein) — община в Германии, в земле Бранденбург.Текст в блоке "Читать" взят с сайта "Википедия" и доступен по лицензии Creative Commons Attribution-ShareAlike; в отдельных случаях могут действовать дополнительные условия.
Другой контент может иметь иную лицензию. Перед использованием материалов сайта WikiSort.org внимательно изучите правила лицензирования конкретных элементов наполнения сайта.
Другой контент может иметь иную лицензию. Перед использованием материалов сайта WikiSort.org внимательно изучите правила лицензирования конкретных элементов наполнения сайта.
2019-2026
WikiSort.org - проект по пересортировке и дополнению контента Википедии
WikiSort.org - проект по пересортировке и дополнению контента Википедии