world.wikisort.org - CanadaThebacha[1] is a territorial electoral district for the Legislative Assembly of Northwest Territories, Canada. The district encompasses Fort Smith and its immediate surroundings.[2]
Provincial electoral district in Northwest Territories, Canada
Thebacha Northwest Territories electoral district Northwest Territories electoral district |
|---|
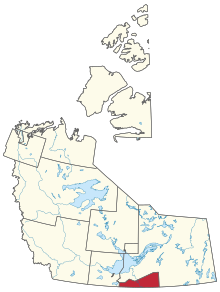 Boundaries of Thebacha |
|
| Legislature | Legislative Assembly of the Northwest Territories |
|---|
| MLA | Frieda Martselos |
|---|
| First contested | 1991 |
|---|
| Last contested | 2019 |
|---|
| Region | South Slave Region |
|---|
| Communities | Fort Smith |
|---|
Members of the Legislative Assembly (MLAs)
| |
Name |
Elected |
Left Office |
| |
Jeannie Marie-Jewell |
1991 |
1995 |
| |
Michael Miltenberger |
1995 |
2015 |
| |
Louis Sebert |
2015 |
2019 |
| |
Frieda Martselos |
2019 |
present |
Election results
2019 election
| 2019 Northwest Territories general election |
|
Name |
Vote |
% |
| |
Frieda Martselos |
504 |
|
| |
Denise Yuhas |
454 |
|
|
| |
Don Jaque |
139 |
|
| |
Louis Sebert |
70 |
|
|
2015 election
| Thebacha |
|
Name |
Vote |
% |
| |
Louis Sebert |
401 |
42.8 |
|
| |
Michael Miltenberger* |
363 |
38.7 |
|
| |
Don Jaque |
173 |
18.5 |
| Total Valid Ballots |
937 |
100% |
| Turnout |
|
51% |
|
2011 election
| 2011 Northwest Territories general election |
|
Name |
Vote |
% |
| |
Michael Miltenberger |
526 |
|
| |
Peter Martselos |
426 |
|
| |
Jeannie Marie-Jewell |
263 |
|
2007 election
| 2007 Northwest Territories general election |
| [2] [a] |
Name |
Vote |
% |
| |
Michael Miltenberger |
531 |
44.81% |
| |
Peter Martselos |
444 |
37.47% |
| |
Jeannie Marie-Jewell |
197 |
16.62% |
| Total Valid Ballots |
1172 |
98.90% |
| Voter Turnout 83.33% |
Rejected Ballots 13 |
2003 election
| 2003 Northwest Territories general election |
| [3] |
Name |
Vote |
% |
| |
Michael Miltenberger |
736 |
65.36 |
|
| |
Don M. Tourangeau |
390 |
34.64% |
| Total Valid Ballots |
1,126 |
100% |
| Voter Turnout 77.68% |
Rejected Ballots 5 |
1999 election
| 1999 Northwest Territories general election |
| [4] |
Name |
Vote |
% |
| |
Michael Miltenberger |
554 |
49.60% |
|
| |
Jeannie Marie-Jewell |
471 |
42.17% |
|
| |
Marilyn Napier |
92 |
8.24 |
| Total Valid Ballots |
1,117 |
100% |
| Voter Turnout 83.90% |
Rejected Ballots 3 |
Notes
^ a: In the 2007 election, percentages assigned to candidates were based on the total votes cast. In prior elections the percentages were based on the valid votes.
References
External links
|
|---|
|
- See also: List of elections
- NWT Legislative Assembly
- List of NWT legislative bodies
|
Текст в блоке "Читать" взят с сайта "Википедия" и доступен по лицензии Creative Commons Attribution-ShareAlike; в отдельных случаях могут действовать дополнительные условия.
Другой контент может иметь иную лицензию. Перед использованием материалов сайта WikiSort.org внимательно изучите правила лицензирования конкретных элементов наполнения сайта.
2019-2026
WikiSort.org - проект по пересортировке и дополнению контента Википедии
