world.wikisort.org - Canada
Saint-Simon is a municipality in southwestern Quebec, Canada on the Yamaska River in Les Maskoutains Regional County Municipality. The population as of the Canada 2016 Census was 1,413.
Saint-Simon | |
|---|---|
Municipality | |
 Route 224 and the church. | |
 Coat of arms | |
 Location within Les Maskoutains RCM | |
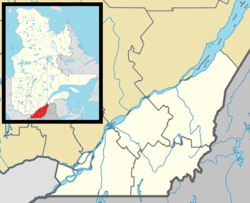 Saint-Simon Location in southern Quebec | |
| Coordinates: 45°44′N 72°52′W[1] | |
| Country | |
| Province | |
| Region | Montérégie |
| RCM | Les Maskoutains |
| Constituted | July 1, 1855 |
| Government | |
| • Mayor | Normand Corbeil |
| • Federal riding | Saint-Hyacinthe—Bagot |
| • Prov. riding | Saint-Hyacinthe |
| Area | |
| • Total | 69.90 km2 (26.99 sq mi) |
| • Land | 69.07 km2 (26.67 sq mi) |
| Population (2016)[5] | |
| • Total | 1,413 |
| • Density | 20.5/km2 (53/sq mi) |
| • Pop 2011-2016 | |
| • Dwellings | 546 |
| Time zone | UTC−5 (EST) |
| • Summer (DST) | UTC−4 (EDT) |
| Postal code(s) | J0H 1Y0 |
| Area code(s) | 450 and 579 |
| Highways | |
| Website | www |
Demographics
Population
Canada census – Saint-Simon community profile
| 2021 | 2016 | 2011 | |
|---|---|---|---|
| Population | 1,386 (-1.9% from 2016) | 1,413 (+14.8% from 2011) | 1,231 (+0.2% from 2006) |
| Land area | 69.05 km2 (26.66 sq mi) | 69.07 km2 (26.67 sq mi) | 68.99 km2 (26.64 sq mi) |
| Population density | 20.1/km2 (52/sq mi) | 20.5/km2 (53/sq mi) | 17.8/km2 (46/sq mi) |
| Median age | 38.8 (M: 39.2, F: 38) | 36.6 (M: 37.2, F: 36.0) | 38.7 (M: 38.6, F: 38.8) |
| Total private dwellings | 540 | 546 | 489 |
| Median household income | $69,163 | $57,023 |
| Year | Pop. | ±% |
|---|---|---|
| 1991 | 1,203 | — |
| 1996 | 1,168 | −2.9% |
| 2001 | 1,118 | −4.3% |
| 2006 | 1,228 | +9.8% |
| 2011 | 1,231 | +0.2% |
| 2016 | 1,413 | +14.8% |
Language
| Canada Census Mother Tongue - Saint-Simon, Montérégie, Quebec[11] | ||||||||||||||||||
|---|---|---|---|---|---|---|---|---|---|---|---|---|---|---|---|---|---|---|
| Census | Total | French |
English |
French & English |
Other | |||||||||||||
| Year | Responses | Count | Trend | Pop % | Count | Trend | Pop % | Count | Trend | Pop % | Count | Trend | Pop % | |||||
2016 |
1,390 |
1,365 | 98.2% | 5 | 0.4% | 0 | 0.0% | 15 | 1.1% | |||||||||
2011 |
1,225 |
1,205 | 98.37% | 10 | 0.82% | 0 | 0.00% | 10 | 0.82% | |||||||||
2006 |
1,210 |
1,180 | 97.52% | 0 | 0.00% | 0 | 0.00% | 30 | 2.48% | |||||||||
2001 |
1,125 |
1,100 | 97.78% | 10 | 0.89% | 0 | 0.00% | 15 | 1.33% | |||||||||
1996 |
1,160 |
1,085 | n/a | 93.53% | 0 | n/a | 0.00% | 0 | n/a | 0.00% | 75 | n/a | 6.47% | |||||
Communities
- Clairveaux-de-Bagot
- Saint-Georges-de-Bagot
- Saint-Simon-de-Bagot
See also
- List of municipalities in Quebec
References
- "Reference number 402073 in Banque de noms de lieux du Québec". toponymie.gouv.qc.ca (in French). Commission de toponymie du Québec.
- Ministère des Affaires municipales, des Régions et de l'Occupation du territoire: Saint-Simon (Montérégie)
- Parliament of Canada Federal Riding History: SAINT-HYACINTHE--BAGOT (Quebec)
- "Census Profile, 2016 Census - Saint-Simon, Municipalité [Census subdivision], Quebec and Saint-Raymond [Population centre], Quebec". 8 February 2017.
- "Census Profile, 2016 Census - Saint-Simon, Municipalité [Census subdivision], Quebec and Saint-Raymond [Population centre], Quebec". 8 February 2017.
- "2021 Community Profiles". 2021 Canadian Census. Statistics Canada. February 4, 2022. Retrieved 2022-04-27.
- "2016 Community Profiles". 2016 Canadian Census. Statistics Canada. August 12, 2021. Retrieved 2022-05-22.
- "2011 Community Profiles". 2011 Canadian Census. Statistics Canada. March 21, 2019. Retrieved 2014-03-22.
- "2006 Community Profiles". 2006 Canadian Census. Statistics Canada. August 20, 2019.
- "2001 Community Profiles". 2001 Canadian Census. Statistics Canada. July 18, 2021.
- Statistics Canada: 1996, 2001, 2006, 2011, 2016 census
Adjacent Municipal Subdivisions | ||||||||||||||||
|---|---|---|---|---|---|---|---|---|---|---|---|---|---|---|---|---|
| ||||||||||||||||
| Cities |
|
|---|---|
| Municipalities |
|
| Parishes | |
| Villages | |
| |
Текст в блоке "Читать" взят с сайта "Википедия" и доступен по лицензии Creative Commons Attribution-ShareAlike; в отдельных случаях могут действовать дополнительные условия.
Другой контент может иметь иную лицензию. Перед использованием материалов сайта WikiSort.org внимательно изучите правила лицензирования конкретных элементов наполнения сайта.
Другой контент может иметь иную лицензию. Перед использованием материалов сайта WikiSort.org внимательно изучите правила лицензирования конкретных элементов наполнения сайта.
2019-2025
WikiSort.org - проект по пересортировке и дополнению контента Википедии
WikiSort.org - проект по пересортировке и дополнению контента Википедии