world.wikisort.org - CanadaHumber Valley is a defunct provincial electoral district for the House of Assembly of Newfoundland and Labrador, Canada. As of the 2011 Census, there were 7,938 eligible voters living within the district.[1]
Provincial electoral district in Newfoundland and Labrador, Canada
Humber Valley Newfoundland and Labrador electoral district Newfoundland and Labrador electoral district |
|---|
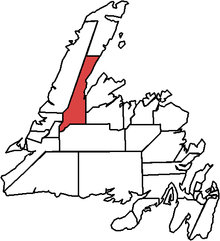 Humber Valley in relation to other districts in Newfoundland |
|
| Legislature | Newfoundland and Labrador House of Assembly |
|---|
| District created | 1975 |
|---|
| Last contested | 2011 |
|---|
|
| Population (2006) | 10,449 |
|---|
| Electors (2011) | 7,938 |
|---|
Humber Valley covered some of the best agricultural land in Newfoundland and Labrador, and ran from Deer Lake to just north of Great Harbour Deep. Apart from Deer Lake, other communities in the district included Cormack, Reidville, Hampden, Sop's Arm and part of Pasadena.
The district was created for the 1975 provincial election out of parts of White Bay South, Humber East and St. George's.
In 2015, the House of Assembly was reduced to 40 seats, and the district of Humber Valley was combined with part of the district of St. Barbe, forming the new district of Humber - Gros Morne.
Members of the House of Assembly
The district has elected the following Members of the House of Assembly:
| |
Member |
Party |
Term |
|
| |
Dwight Ball |
Liberal |
2011–2015 |
| |
Darryl Kelly |
Progressive Conservative |
2007-2011 |
| |
Dwight Ball |
Liberal |
2007 |
| |
Kathy Goudie |
Progressive Conservative |
2003-2007 |
| |
Rick Woodford |
Liberal |
1996-2003 |
| |
Rick Woodford |
Progressive Conservative |
1985-1996 |
| |
Wallace House |
Progressive Conservative |
1975-1985 |
|
White Bay South
| |
Member |
Party |
Term |
|
| |
William N. Rowe |
Liberal |
1966-1975 |
|
| |
Frederick W. Rowe |
Liberal |
1956-1966 |
|
[2]
Election results
| 2011 Newfoundland and Labrador general election |
| Party |
Candidate |
Votes | % | |
|
Liberal | Dwight Ball | 2,609 | 48.14 | +1.04 |
|
Progressive Conservative | Darryl Kelly | 2,541 | 46.88 | -4.54 |
|
New Democratic | Sheldon Hynes | 270 | 4.98 | +3.50 |
| Total valid votes |
5,420 | 99.65 |
| Total rejected ballots |
19 | 0.35 | +0.09 |
| Turnout |
5,439 | 67.77 | -6.52 |
| Eligible voters |
8,026 |
|
Liberal gain from Progressive Conservative |
Swing |
+2.79 |
| 2007 Newfoundland and Labrador general election |
| Party |
Candidate |
Votes | % | |
|
Progressive Conservative | Darryl Kelly | 3,023 | 51.42 | +2.88 |
|
Liberal | Dwight Ball | 2,769 | 47.10 | -1.60 |
|
New Democratic | Kris Hynes | 87 | 1.48 | -1.28 |
| Total valid votes |
5,879 | 99.75 |
| Total rejected ballots |
15 | 0.25 | +0.03 |
| Turnout |
5,894 | 74.29 | +12.21 |
| Eligible voters |
7,934 |
|
Progressive Conservative gain from Liberal |
Swing |
+2.24 |
| 2003 Newfoundland and Labrador general election |
| Party |
Candidate |
Votes | % | |
|
Progressive Conservative | Kathy Goudie | 2,796 | 52.72 | +20.93 |
|
Liberal | Dwight Ball | 2,507 | 47.28 | -20.93 |
| Total valid votes |
5,303 | 99.44 |
| Total rejected ballots |
30 | 0.56 | +0.18 |
| Turnout |
5,333 | 78.02 | +19.92 |
| Eligible voters |
6,835 |
|
Progressive Conservative gain from Liberal |
Swing |
+20.93 |
| 1999 Newfoundland general election |
| Party |
Candidate |
Votes | % | |
|
Liberal | Rick Woodford | 3,051 | 68.21 | -6.70 |
|
Progressive Conservative | Warren Rose | 1,422 | 31.79 | +6.70 |
| Total valid votes |
4,473 | 99.62 |
| Total rejected ballots |
17 | 0.38 | -0.04 |
| Turnout |
4,490 | 58.10 | -13.17 |
| Eligible voters |
7,728 |
|
Liberal hold |
Swing |
-6.70 |
| 1996 Newfoundland general election |
| Party |
Candidate |
Votes | % | |
|
Liberal | Rick Woodford | 4,109 | 74.91 | +34.51 |
|
Progressive Conservative | Evelyn Organ | 1,376 | 25.09 | -32.57 |
| Total valid votes |
5,485 | 99.58 |
| Total rejected ballots |
23 | 0.42 | +0.01 |
| Turnout |
5,508 | 71.27 | -13.22 |
| Eligible voters |
7,728 |
|
Liberal gain from Progressive Conservative |
Swing |
+33.54 |
| 1993 Newfoundland general election |
| Party |
Candidate |
Votes | % | |
|
Progressive Conservative | Rick Woodford | 2,944 | 57.66 | +1.82 |
|
Liberal | Gary Gale | 2,063 | 40.40 | -3.76 |
|
New Democratic | Catherine Shortall | 99 | 1.94 | – |
| Total valid votes |
5,106 | 99.59 |
| Total rejected ballots |
21 | 0.41 | -0.41 |
| Turnout |
5,127 | 84.49 | +4.53 |
| Eligible voters |
6,068 |
|
Progressive Conservative hold |
Swing |
+1.58 |
| 1989 Newfoundland general election |
| Party |
Candidate |
Votes | % | |
|
Progressive Conservative | Rick Woodford | 2,687 | 55.84 | +8.20 |
|
Liberal | Gary Gale | 2,125 | 44.16 | +5.05 |
| Total valid votes |
4,812 | 99.18 |
| Total rejected ballots |
40 | 0.82 | +0.50 |
| Turnout |
4,852 | 79.96 | +3.56 |
| Eligible voters |
6,068 |
|
Progressive Conservative hold |
Swing |
+2.79 |
| 1985 Newfoundland general election |
| Party |
Candidate |
Votes | % | |
|
Progressive Conservative | Rick Woodford | 2,197 | 47.64 | -15.89 |
|
Liberal | David Hedd | 1,804 | 39.12 | +2.64 |
|
New Democratic | Terry Brazil | 611 | 13.25 | – |
| Total valid votes |
4,612 | 99.68 |
| Total rejected ballots |
15 | 0.32 | -0.22 |
| Turnout |
4,627 | 76.40 | -0.14 |
| Eligible voters |
6,056 |
|
Progressive Conservative hold |
Swing |
-9.27 |
| 1982 Newfoundland general election |
| Party |
Candidate |
Votes | % | |
|
Progressive Conservative | Wallace House | 3,480 | 63.53 | +10.89 |
|
Liberal | Kevin Saunders | 1,998 | 36.47 | -0.32 |
| Total valid votes |
5,478 | 99.46 |
| Total rejected ballots |
30 | 0.54 | +0.29 |
| Turnout |
5,508 | 76.54 | +11.30 |
| Eligible voters |
7,196 |
|
Progressive Conservative hold |
Swing |
+5.60 |
| 1979 Newfoundland general election |
| Party |
Candidate |
Votes | % | |
|
Progressive Conservative | Wallace House | 2,465 | 52.64 | -0.40 |
|
Liberal | Kevin Saunders | 1,723 | 36.79 | +15.25 |
|
New Democratic | Allan Harvey French | 495 | 10.57 | – |
| Total valid votes |
4,683 | 99.74 |
| Total rejected ballots |
12 | 0.26 | -0.22 |
| Turnout |
4,695 | 65.24 | -4.17 |
| Eligible voters |
7,196 |
|
Progressive Conservative hold |
Swing |
-7.83 |
| 1975 Newfoundland general election |
| Party |
Candidate |
Votes | % |
|
Progressive Conservative | Wallace House | 2,221 | 53.03 |
|
Liberal | Stanley Earl Parsons | 902 | 21.54 |
|
Reform Liberal | Alex John Wiseman | 865 | 20.65 |
|
Independent | Kenneth R. J. Prowse | 200 | 4.78 |
| Total valid votes |
4,188 | 99.52 |
| Total rejected ballots |
20 | 0.48 |
| Turnout |
4,208 | 69.42 |
| Eligible voters |
6,062 |
[3]
References
External links
Newfoundland and Labrador Provincial Electoral Districts |
|---|
- Baie Verte-Green Bay
- Bonavista
- Burgeo-La Poile
- Burin-Grand Bank
- Cape St. Francis
- Carbonear-Trinity-Bay de Verde
- Cartwright-L'Anse au Clair
- Conception Bay East–Bell Island
- Conception Bay South
- Corner Brook
- Exploits
- Ferryland
- Fogo Island-Cape Freels
- Fortune Bay-Cape La Hune
- Gander
- Grand Falls-Windsor-Buchans
- Harbour Grace-Port de Grave
- Harbour Main
- Humber-Bay of Islands
- Humber-Gros Morne
- Labrador West
- Lake Melville
- Lewisporte-Twillingate
- Mount Pearl North
- Mount Pearl-Southlands
- Mount Scio
- Placentia-St. Mary's
- Placentia West-Bellevue
- St. Barbe-L'Anse aux Meadows
- St. George's-Humber
- St. John's Centre
- St. John's East-Quidi Vidi
- St. John's West
- Stephenville-Port au Port
- Terra Nova
- Topsail-Paradise
- Torngat Mountains
- Virginia Waters-Pleasantville
- Waterford Valley
- Windsor Lake
|
- See also
- 2021 general election
- List of elections
- Politics
|
Текст в блоке "Читать" взят с сайта "Википедия" и доступен по лицензии Creative Commons Attribution-ShareAlike; в отдельных случаях могут действовать дополнительные условия.
Другой контент может иметь иную лицензию. Перед использованием материалов сайта WikiSort.org внимательно изучите правила лицензирования конкретных элементов наполнения сайта.
2019-2026
WikiSort.org - проект по пересортировке и дополнению контента Википедии
