world.wikisort.org - CanadaConception Bay South is a provincial electoral district for the House of Assembly of Newfoundland and Labrador, Canada. As of 2011 there are 9,938 eligible voters living within the district.[1]
Provincial electoral district in Newfoundland and Labrador, Canada
Conception Bay South Newfoundland and Labrador electoral district Newfoundland and Labrador electoral district |
|---|
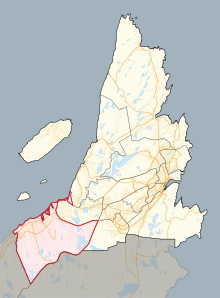 Location in the St. John's area |
|
| Legislature | Newfoundland and Labrador House of Assembly |
|---|
| MHA | Barry Petten
Progressive Conservative |
|---|
| District created | 1975 |
|---|
| First contested | 1975 |
|---|
| Last contested | 2021 |
|---|
|
| Population (2011) | 14,558 |
|---|
| Electors (2015) | 9,025 |
|---|
| Area (km²) | 85 |
|---|
| Census division(s) | Division No. 1 |
|---|
| Census subdivision(s) | Conception Bay South, St. John's (part) |
|---|
Composed of part of the town of Conception Bay South. A mix of rural and suburban populations, especially as the town of Conception Bay South grows. The district includes the communities of Foxtrap, Long Pond, Manuels, Kelligrews and part of Chamberlains. It is part of the St. John's metropolitan area.
The riding was created for the 1975 election from Harbour Main and St. John's North.
Members of the House of Assembly
The district has elected the following Members of the House of Assembly:
| Assembly |
Years |
Member |
Party |
| St. John's North and Harbour Main prior to 1975 |
| 37th |
1975-1979 |
|
John Nolan |
Liberal |
| 38th |
1979-1982 |
|
John Butt |
Progressive Conservative |
| 39th |
1982-1985 |
| 40th |
1985-1989 |
| 41st |
1989-1993 |
|
Pat Cowan |
Liberal |
| 42nd |
1993-1996 |
| 43rd |
1996-1999 |
|
Bob French |
Progressive Conservative |
| 44th |
1999-2002 |
| 2002-2003 |
Terry French |
| 45th |
2003-2007 |
| 46th |
2007-2011 |
| 47th |
2011-2014 |
| 2014-2015 |
|
Rex Hillier |
Liberal |
| 48th |
2015-2019 |
|
Barry Petten |
Progressive Conservative |
| 49th |
2019–2021 |
| 50th |
2021–Present |
Election results
Graph of election results (minor parties that never got 2% of the vote or didn't run consistently are omitted)
| 2021 Newfoundland and Labrador general election |
| Party |
Candidate |
Votes | % | |
|
Progressive Conservative | Barry Petten | 3,063 | 57.09 | -5.43 |
|
Liberal | Shelley Moores | 1,941 | 36.18 | +13.40 |
|
New Democratic | Andrew Lovell | 225 | 4.19 | |
|
NL Alliance | Warrick Butler | 136 | 2.53 | -12.16 |
| Total valid votes |
5,365 |
| Total rejected ballots |
|
| Turnout |
|
| Eligible voters |
|
|
Progressive Conservative hold |
Swing |
-5.43 |
|
| 2019 Newfoundland and Labrador general election |
| Party |
Candidate |
Votes | % | |
|
Progressive Conservative | Barry Petten | 3,447 | 62.52 | +14.80 |
|
Liberal | Kevin Baker | 1,256 | 22.78 | -21.44 |
|
NL Alliance | Warrick Butler | 810 | 14.69 | – |
| Total valid votes |
5,513 | 99.01 |
| Total rejected ballots |
55 | 0.99 | +0.63 |
| Turnout |
5,568 | 61.85 | +6.85 |
| Eligible voters |
9,003 |
|
Progressive Conservative hold |
Swing |
+18.12 |
| 2015 Newfoundland and Labrador general election |
| Party |
Candidate |
Votes | % | |
|
Progressive Conservative | Barry Petten | 2,360 | 47.72 | +0.04 |
|
Liberal | Steve Porter | 2,187 | 44.23 | -5.04 |
|
New Democratic | Jeanne Clarke | 398 | 8.05 | +5.00 |
| Total valid votes |
4,945 | 99.64 | – |
| Total rejected ballots |
18 | 0.36 | – |
| Turnout |
4,963 | 54.99 | +11.42 |
| Eligible voters |
9,025 |
|
Progressive Conservative gain from Liberal |
Swing |
+2.54 |
| Source: Elections Newfoundland and Labrador[2] |
Newfoundland and Labrador provincial by-election, November 5, 2014
upon the resignation of Terry French |
| Party |
Candidate |
Votes | % | |
|
Liberal | Rex Hillier | 2,102 | 49.27 | +42.52 |
|
Progressive Conservative | Barry Petten | 2,034 | 47.68 | -21.51 |
|
New Democratic | Cameron Mercer-Maillet | 130 | 3.05 | -21.01 |
| Total valid votes |
4,266 | 99.77 | – |
| Total rejected ballots |
10 | 0.23 | – |
| Turnout |
4,276 | 43.57 |
| Eligible voters |
9,813 |
|
Liberal gain from Progressive Conservative |
Swing |
+32.02 |
| Source: Elections Newfoundland and Labrador[3] |
| 2011 Newfoundland and Labrador general election |
| Party |
Candidate |
Votes | % | |
|
Progressive Conservative | Terry French | 3,632 | 69.19 | -10.19 |
|
New Democratic | Noah Davis-Power | 1,263 | 24.06 | +19.64 |
|
Liberal | Cynthia Layden Barron | 354 | 6.75 | -9.45 |
| Total valid votes |
5,249 | 99.73 | – |
| Total rejected ballots |
14 | 0.27 | – |
| Turnout |
5,263 | 74.84 | +3.615 |
| Eligible voters |
9,527 |
|
Progressive Conservative hold |
Swing |
-14.92 |
| Source: Elections Newfoundland and Labrador[4] |
| 2007 Newfoundland and Labrador general election |
| Party |
Candidate |
Votes | % | |
|
Progressive Conservative | Terry French | 4,670 | 79.38 | -3.72 |
|
Liberal | Jerry E. Young | 953 | 16.20 | +4.81 |
|
New Democratic | Touria Tougui | 260 | 4.42 | -1.09 |
| Total valid votes |
5,883 | 99.64 | – |
| Total rejected ballots |
21 | 0.36 | – |
| Turnout |
5,904 | 61.97 | -2.64 |
| Eligible voters |
9,527 |
|
Progressive Conservative hold |
Swing |
-4.27 |
| Source: Elections Newfoundland and Labrador[5] |
| 2003 Newfoundland and Labrador general election |
| Party |
Candidate |
Votes | % | |
|
Progressive Conservative | Terry French | 5,606 | 83.10 | +0.79 |
|
Liberal | Andy Lewis | 768 | 11.39 | -5.04 |
|
New Democratic | Sheina Lerman | 372 | 5.51 | +4.25 |
| Total valid votes |
6,746 | 99.75 | – |
| Total rejected ballots |
17 | 0.25 | – |
| Turnout |
6,763 | 64.61 | +3.61 |
| Eligible voters |
10,467 |
|
Progressive Conservative hold |
Swing |
+2.92 |
| Source: Elections Newfoundland and Labrador[6] |
Newfoundland and Labrador provincial by-election, November 12, 2002
upon the death of Bob French |
| Party |
Candidate |
Votes | % | |
|
Progressive Conservative | Terry French | 4,761 | 82.31 | +17.77 |
|
Liberal | Gary Corbett | 950 | 16.43 | -13.55 |
|
New Democratic | Ann Price | 73 | 1.26 | -4.22 |
| Total valid votes |
5,784 | 99.74 | – |
| Total rejected ballots |
15 | 0.26 | – |
| Turnout |
5,799 | 61.00 | -1.18 |
| Eligible voters |
9,507 |
|
Progressive Conservative hold |
Swing |
+15.66 |
| Source: Elections Newfoundland and Labrador[7] |
| 1999 Newfoundland and Labrador general election |
| Party |
Candidate |
Votes | % | |
|
Progressive Conservative | Bob French | 3,888 | 64.54 | +14.04 |
|
Liberal | Bill Lee | 1,806 | 29.98 | -13.52 |
|
New Democratic | Reg Porter | 330 | 5.48 | -0.52 |
| Total valid votes |
6,024 | 99.69 | – |
| Total rejected ballots |
19 | 0.31 | – |
| Turnout |
6,043 | 62.18 | -5.43 |
| Eligible voters |
9,719 |
|
Progressive Conservative hold |
Swing |
+13.78 |
| Source: Elections Newfoundland and Labrador[8] |
| 1996 Newfoundland and Labrador general election |
| Party |
Candidate |
Votes | % | |
|
Progressive Conservative | Bob French | 3,051 | 50.50 | +12.82 |
|
Liberal | Bill Dawe | 2,628 | 43.50 | -3.28 |
|
New Democratic | Harvey Taylor | 363 | 6.00 | -7.98 |
| Total valid votes |
6,042 | 99.74 | – |
| Total rejected ballots |
16 | 0.26 | – |
| Turnout |
6,058 | 67.61 | +0.25 |
| Eligible voters |
8,960 |
|
Progressive Conservative gain from Liberal |
Swing |
+8.05 |
| Source: Elections Newfoundland and Labrador[9] |
| 1993 Newfoundland and Labrador general election |
| Party |
Candidate |
Votes | % | |
|
Liberal | Patt Cowan | 2,995 | 46.77 | -6.72 |
|
Progressive Conservative | Martin Suter | 2,413 | 37.69 | -6.74 |
|
New Democratic | George Corbett | 895 | 13.98 | +11.89 |
|
Independent | Elijah Dawe | 100 | 1.56 | |
| Total valid votes |
6,403 | 99.75 | – |
| Total rejected ballots |
16 | 0.25 | +0.04 |
| Turnout |
6,419 | 100.85 | +9.41 |
| Eligible voters |
6,365 |
|
Liberal hold |
Swing |
+0.01 |
| Source: Elections Newfoundland and Labrador[10] |
| 1989 Newfoundland and Labrador general election |
| Party |
Candidate |
Votes | % | |
|
Liberal | Patt Cowan | 3,107 | 53.49 | +14.59 |
|
Progressive Conservative | John Butt | 2,580 | 44.42 | -4.38 |
|
New Democratic | Edgar Russell | 121 | 2.08 | -5.82 |
| Total valid votes |
5,808 | 99.79 | – |
| Total rejected ballots |
12 | 0.21 | –0.08 |
| Turnout |
5,820 | 91.44 | +17.93 |
| Eligible voters |
6,365 |
|
Liberal gain from Progressive Conservative |
Swing |
+9.49 |
| Source: Elections Newfoundland and Labrador[11] |
| 1985 Newfoundland general election |
| Party |
Candidate |
Votes | % | |
|
Progressive Conservative | John Butt | 2,179 | 48.80 | -21.75 |
|
Liberal | Ron Clarke | 1,737 | 38.90 | +17.09 |
|
New Democratic | Art Dawe | 353 | 7.91 | +4.08 |
|
Independent | Gordon Dawe | 196 | 4.39 | |
| Total valid votes |
4,465 | 99.71 | – |
| Total rejected ballots |
13 | 0.29 | +0.05 |
| Turnout |
4,478 | 73.51 | -2.25 |
| Eligible voters |
6,092 |
|
Progressive Conservative hold |
Swing |
-19.42 |
| Source: Elections Newfoundland and Labrador[12] |
| 1982 Newfoundland general election |
| Party |
Candidate |
Votes | % | |
|
Progressive Conservative | John Butt | 5,382 | 70.56 | +24.29 |
|
Liberal | Gerald Greenslade | 1,664 | 21.81 | -12.79 |
|
New Democratic | Howard Story | 292 | 3.83 | -0.39 |
|
Independent | Jerry LeDrew | 290 | 3.80 | |
| Total valid votes |
7,628 | 99.76 | – |
| Total rejected ballots |
18 | 0.24 | –0.28 |
| Turnout |
7,646 | 75.76 | +0.36 |
| Eligible voters |
10,093 |
|
Progressive Conservative hold |
Swing |
+18.54 |
| Source: Elections Newfoundland and Labrador[13] |
| 1979 Newfoundland general election |
| Party |
Candidate |
Votes | % | |
|
Progressive Conservative | John Butt | 3,503 | 46.27 | +2.06 |
|
Liberal | John A. Nolan | 2,620 | 34.61 | -10.33 |
|
Independent | Gordon Dawe | 1,035 | 13.67 | |
|
New Democratic | Boyd Batten | 319 | 4.21 | +0.10 |
|
Independent | Richard Gosse | 94 | 1.24 | |
| Total valid votes |
7,571 | 99.49 | – |
| Total rejected ballots |
39 | 0.51 | +0.04 |
| Turnout |
7,610 | 75.40 | -3.84 |
| Eligible voters |
10,093 |
|
Progressive Conservative gain from Liberal |
Swing |
+6.19 |
| Source: Elections Newfoundland and Labrador[14] |
| 1975 Newfoundland general election |
| Party |
Candidate |
Votes | % |
|
Liberal | John A. Nolan | 3,112 | 44.93 |
|
Progressive Conservative | Gordon Dawe | 3,062 | 44.21 |
|
Reform Liberal | Ralph C. Petten | 467 | 6.74 |
|
New Democratic | Wilson Porter | 285 | 4.11 |
| Total valid votes |
6,926 | 99.53 |
| Total rejected ballots |
33 | 0.47 |
| Turnout |
6,959 | 79.24 |
| Eligible voters |
8,782 |
| Source: Elections Newfoundland and Labrador[15] |
References
- "Summary of Polling Divisions CONCEPTION BAY SOUTH" (PDF). Elections Newfoundland and Labrador. 3 August 2011. Retrieved 5 September 2011.[permanent dead link]
- "2015 Provincial General Election Report" (PDF). Elections Newfoundland and Labrador. 25 July 2016. Archived from the original (PDF) on 18 July 2017. Retrieved 21 November 2018.
- "November 5, 2014 By-Election Report" (PDF). Elections Newfoundland and Labrador. 9 February 2015. Archived from the original (PDF) on 5 December 2018. Retrieved 4 December 2018.
- "Report on the Provincial General Election, October 11, 2011" (PDF). Office of the Chief Electoral Officer of Newfoundland and Labrador. 8 June 2012. Archived from the original (PDF) on 4 March 2016. Retrieved 21 November 2018.
- "Report on the Provincial General Election, October 9, 2007" (PDF). Office of the Chief Electoral Officer of Newfoundland and Labrador. 7 July 2008. Archived from the original (PDF) on 20 October 2016. Retrieved 21 November 2018.
- "Report on the October 21, 2003 General Election" (PDF). Office of the Chief Electoral Officer of Newfoundland and Labrador. 9 July 2004. Archived from the original (PDF) on 4 March 2016. Retrieved 21 November 2018.
- "Report of the Chief Electoral Officer on the Conception Bay South By-Election, November 12, 2002" (PDF). Elections Newfoundland and Labrador. 2003. Archived from the original (PDF) on 23 November 2015. Retrieved 5 December 2018.
- "Report of the Chief Electoral Officer on the General Election for the Forty-Fourth General Assembly, February 9, 1999" (PDF). Office of the Chief Electoral Officer of Newfoundland and Labrador. 9 November 1999. Archived from the original (PDF) on 28 November 2015. Retrieved 21 November 2018.
- "Report of the Chief Electoral Officer on the General Election for the Forty-Third General Assembly, February 22, 1996" (PDF). Office of the Chief Electoral Officer of Newfoundland and Labrador. 28 October 1996. Archived from the original (PDF) on 28 November 2015. Retrieved 21 November 2018.
- "Report of the Chief Electoral Officer on the General Election for the Forty-Second General Assembly, May 3, 1993" (PDF). Office of the Chief Electoral Officer of Newfoundland and Labrador. 1994. Archived from the original (PDF) on 28 November 2015. Retrieved 21 November 2018.
- "Election Statistics 1989" (PDF). Office of the Chief Electoral Officer of Newfoundland and Labrador. 1989. Archived from the original (PDF) on 4 March 2016. Retrieved 21 November 2018.
- "Election Returns 1985" (PDF). Office of the Chief Electoral Officer of Newfoundland and Labrador. 22 October 1985. Archived from the original (PDF) on 4 March 2016. Retrieved 21 November 2018.
- "Election Returns 1982" (PDF). Office of the Chief Electoral Officer of Newfoundland and Labrador. 25 August 1982. Archived from the original (PDF) on 23 November 2015. Retrieved 21 November 2018.
- "Election Returns 1979" (PDF). Office of the Chief Electoral Officer of Newfoundland and Labrador. 12 October 1979. Archived from the original (PDF) on 4 March 2016. Retrieved 22 November 2018.
- "Election Returns 1975" (PDF). Office of the Chief Electoral Officer of Newfoundland and Labrador. 30 April 1976. Archived from the original (PDF) on 23 November 2015. Retrieved 22 November 2018.
External links
Newfoundland and Labrador Provincial Electoral Districts |
|---|
- Baie Verte-Green Bay
- Bonavista
- Burgeo-La Poile
- Burin-Grand Bank
- Cape St. Francis
- Carbonear-Trinity-Bay de Verde
- Cartwright-L'Anse au Clair
- Conception Bay East–Bell Island
- Conception Bay South
- Corner Brook
- Exploits
- Ferryland
- Fogo Island-Cape Freels
- Fortune Bay-Cape La Hune
- Gander
- Grand Falls-Windsor-Buchans
- Harbour Grace-Port de Grave
- Harbour Main
- Humber-Bay of Islands
- Humber-Gros Morne
- Labrador West
- Lake Melville
- Lewisporte-Twillingate
- Mount Pearl North
- Mount Pearl-Southlands
- Mount Scio
- Placentia-St. Mary's
- Placentia West-Bellevue
- St. Barbe-L'Anse aux Meadows
- St. George's-Humber
- St. John's Centre
- St. John's East-Quidi Vidi
- St. John's West
- Stephenville-Port au Port
- Terra Nova
- Topsail-Paradise
- Torngat Mountains
- Virginia Waters-Pleasantville
- Waterford Valley
- Windsor Lake
|
- See also
- 2021 general election
- List of elections
- Politics
|
Текст в блоке "Читать" взят с сайта "Википедия" и доступен по лицензии Creative Commons Attribution-ShareAlike; в отдельных случаях могут действовать дополнительные условия.
Другой контент может иметь иную лицензию. Перед использованием материалов сайта WikiSort.org внимательно изучите правила лицензирования конкретных элементов наполнения сайта.
2019-2026
WikiSort.org - проект по пересортировке и дополнению контента Википедии
