world.wikisort.org - Canada
Chazel is a municipality in northwestern Quebec, Canada, in the Abitibi-Ouest Regional County Municipality. It had a population of 254 in the 2021 Canadian Census.
Chazel | |
|---|---|
Municipality | |
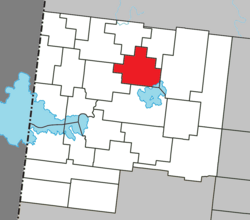 Location within Abitibi-Ouest RCM. | |
 Chazel Location in western Quebec. | |
| Coordinates: 48°52′N 79°03′W[1] | |
| Country | |
| Province | |
| Region | Abitibi-Témiscamingue |
| RCM | Abitibi-Ouest |
| Settled | 1917 |
| Constituted | February 19, 1938 |
| Government | |
| • Mayor | Daniel Favreau |
| • Federal riding | Abitibi—Témiscamingue |
| • Prov. riding | Abitibi-Ouest |
| Area | |
| • Total | 138.90 km2 (53.63 sq mi) |
| • Land | 133.55 km2 (51.56 sq mi) |
| Population (2021)[3] | |
| • Total | 254 |
| • Density | 1.9/km2 (5/sq mi) |
| • Pop 2016-2021 | |
| • Dwellings | 131 |
| Time zone | UTC−05:00 (EST) |
| • Summer (DST) | UTC−04:00 (EDT) |
| Postal code(s) | J0Z 1N0 |
| Area code | 819 |
| Highways | No major routes |
| Website | www |
The municipality was incorporated on February 19, 1938, as the Municipality of Saint-Janvier, and commonly known as Saint-Janvier-de-Chazel. In 1991, it was renamed to Chazel, named after Guillaume Chazel, a French soldier who died in 1725 near Cape Breton.[1]
Demographics
Population
Canada census – Chazel community profile
| 2021 | 2016 | 2011 | |
|---|---|---|---|
| Population | 254 (-12.1% from 2016) | 289 (-0.0% from 2011) | 289 (-10.0% from 2006) |
| Land area | 133.55 km2 (51.56 sq mi) | 133.96 km2 (51.72 sq mi) | 134.30 km2 (51.85 sq mi) |
| Population density | 1.9/km2 (4.9/sq mi) | 2.2/km2 (5.7/sq mi) | 2.2/km2 (5.7/sq mi) |
| Median age | 45.6 (M: 49.6, F: 43.6) | 45.3 (M: 45.2, F: 45.5) | 44.4 (M: 45.0, F: 44.2) |
| Total private dwellings | 131 | 132 | 125 |
| Median household income | $73,500 | $65,280 | $56,800 |
|
|
|
Language
| Canada Census Mother Tongue - Chazel, Quebec[9] | ||||||||||||||||||
|---|---|---|---|---|---|---|---|---|---|---|---|---|---|---|---|---|---|---|
| Census | Total | French |
English |
French & English |
Other | |||||||||||||
| Year | Responses | Count | Trend | Pop % | Count | Trend | Pop % | Count | Trend | Pop % | Count | Trend | Pop % | |||||
2021 |
250 |
240 | 96.0% | 5 | 2.0% | 5 | 2.0% | 0 | 0.0% | |||||||||
2016 |
290 |
285 | 98.3% | 5 | 1.7% | 0 | 0.0% | 0 | 0.0% | |||||||||
2011 |
290 |
290 | 100.0% | 0 | 0.0% | 0 | 0.0% | 0 | 0.0% | |||||||||
2006 |
320 |
320 | 100.0% | 0 | 0.0% | 0 | 0.0% | 0 | 0.0% | |||||||||
2001 |
330 |
320 | 97.0% | 10 | 3.0% | 0 | 0.0% | 0 | 0.0% | |||||||||
1996 |
390 |
390 | n/a | 100.0% | 0 | n/a | 0.0% | 0 | n/a | 0.0% | 0 | n/a | 0.0% | |||||
See also
- List of municipalities in Quebec
Municipal council
- Mayor: Daniel Favreau
- Councillors: Nancy Bureau, Anne Breton, René Frappier, Armande Bouchard, Hélène Lévesque-Charrois, Yves Frappier
Historical publications
- Saint-Janvier-de-Chazel – Histoire et généalogie et occupation du territoire, published by "Société d'histoire et de généalogie de Val-d'Or", Gisèle Chamberland, 2004, 315 pages.(in French)
References
- "Chazel (Municipalité)" (in French). Commission de toponymie du Québec. Retrieved 2011-01-10.
- "Chazel". Répertoire des municipalités (in French). Ministère des Affaires municipales, des Régions et de l'Occupation du territoire. Archived from the original on 2012-06-01. Retrieved 2011-01-10.
- "Chazel census profile". 2021 Census data. Statistics Canada. Retrieved 2022-05-06.
- "2021 Community Profiles". 2021 Canadian Census. Statistics Canada. February 4, 2022. Retrieved 2022-08-23.
- "2016 Community Profiles". 2016 Canadian Census. Statistics Canada. August 12, 2021. Retrieved 2022-07-14.
- "2011 Community Profiles". 2011 Canadian Census. Statistics Canada. March 21, 2019. Retrieved 2014-03-30.
- "2006 Community Profiles". 2006 Canadian Census. Statistics Canada. August 20, 2019.
- "2001 Community Profiles". 2001 Canadian Census. Statistics Canada. July 18, 2021.
- Statistics Canada: 1996, 2001, 2006, 2011, 2016, 2021 census
Adjacent Municipal Subdivisions | ||||||||||||||||
|---|---|---|---|---|---|---|---|---|---|---|---|---|---|---|---|---|
| ||||||||||||||||
| Towns |
|
|---|---|
| Municipalities |
|
| Townships |
|
| Parishes |
|
| Unorganized territories | |
| |
| Authority control |
|
|---|
Текст в блоке "Читать" взят с сайта "Википедия" и доступен по лицензии Creative Commons Attribution-ShareAlike; в отдельных случаях могут действовать дополнительные условия.
Другой контент может иметь иную лицензию. Перед использованием материалов сайта WikiSort.org внимательно изучите правила лицензирования конкретных элементов наполнения сайта.
Другой контент может иметь иную лицензию. Перед использованием материалов сайта WikiSort.org внимательно изучите правила лицензирования конкретных элементов наполнения сайта.
2019-2026
WikiSort.org - проект по пересортировке и дополнению контента Википедии
WikiSort.org - проект по пересортировке и дополнению контента Википедии