world.wikisort.org - USA
The Cincinnati metropolitan area and also known as the Cincinnati Tri-State area, or Greater Cincinnati) is a metropolitan area centered on Cincinnati and including surrounding counties in the U.S. states of Ohio, Kentucky, and Indiana. The area is commonly known as Greater Cincinnati.
Cincinnati, OH–KY–IN Metropolitan Statistical Area
Greater Cincinnati | |
|---|---|
Metropolitan area | |
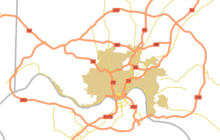
 A NASA image of the Cincinnati metropolitan area. The Ohio River separates the states of Ohio and Kentucky. | |
| Motto: The Queen City | |
 Counties in Ohio, Kentucky and Indiana | |
| Country | |
| State(s) | |
| Largest city | |
| Counties | |
| Area | |
| • Total | 4,808 sq mi (12,450 km2) |
| Elevation | 551 ft (168 m) |
| Population (2015)[1] | |
| • Metro density | 445/sq mi (172/km2) |
| • MSA | 2,256,884 (28th)[2] |
| MSA/CSA = 2015, Urban = 2013 | |
| Time zone | UTC−5 (EST) |
| • Summer (DST) | UTC−4 (EDT) |
| Area code(s) | 513, 283, 859, 937, 812 |
| GDP | $153.9 billion (2019) USD[3] |
| GDP per capita | $54,712 |
The United States Census Bureau's formal name for the area is the Cincinnati, OH–KY–IN Metropolitan Statistical Area. As of the 2010 U.S. Census, this MSA had a population of 2,114,580, making Greater Cincinnati the 29th most populous metropolitan area in the United States, the largest metro area primarily in Ohio, followed by Columbus (2nd) and Cleveland (3rd).[4] The Census also lists the Cincinnati–Wilmington–Maysville, OH–KY–IN Combined Statistical Area, which adds Clinton County, Ohio (defined as the Wilmington, OH micropolitan area) and Mason County, Kentucky (defined as the Maysville, KY micropolitan area) for a 2014 estimated population of 2,208,450.[5] The Cincinnati metropolitan area is considered part of the Great Lakes Megalopolis.
Census designation history
The Cincinnati, OH–KY–IN, MSA was originally formed by the United States Census Bureau in 1950 and consisted of the Kentucky counties of Campbell and Kenton and the Ohio county of Hamilton. As surrounding counties saw an increase in their population densities and the number of their residents employed within Hamilton County, they met Census criteria to be added to the MSA. The Hamilton–Middletown, OH MSA was also formed in 1950 and consisted solely of Butler County, Ohio.
In 1990, the Census changed designation of the areas known as MSAs to Primary Metropolitan Statistical Area (PMSA), and a new Consolidated Metropolitan Statistical Area (CMSA) grouping was created. From 1990 through 2005, the Cincinnati–Hamilton–Middletown CMSA included the Cincinnati–Hamilton, OH–KY–IN PMSA and the Hamilton–Middletown, OH PMSA.
As of December 2005, Census terminology changed again, eliminating the PMSA/CMSA terminology. Consolidated Statistical Areas (CSA) combine more than one Core Based Statistical Area (CBSA). Newly defined MSAs (Metropolitan) and µSAs (Micropolitan) Statistical Areas are CBSAs. From 2005 to 2013, the Cincinnati–Middletown–Wilmington CSA included the Cincinnati–Middletown MSA (defined as the old Cincinnati–Hamilton–Middletown CMSA), and Wilmington, OH µSA (Clinton County, Ohio).
In 2013, the CSA was redefined again. The Cincinnati–Middletown MSA was renamed the Cincinnati MSA. The Wilmington, OH µSA remained in the CSA. The Maysville, KY µSA, which had previously consisted of Mason and Lewis Counties in Kentucky, was redefined as consisting solely of Mason County and added to the CSA. The name of the CSA accordingly changed to the Cincinnati–Wilmington–Maysville CSA.
In September 2018, Union County, Indiana, was added to the Cincinnati MSA.[6]
Population growth

The metropolitan area's population has grown 8.1 percent between Census 2000 and the 2009 Census population estimate, just under the national population growth rate of 9.2 percent over the same period. This growth rate is about in the middle of the growth rates of other similarly sized mid-western metropolitan areas. For example, the Cleveland metropolitan area lost approximately 2% of population, while Grand Rapids and Louisville both respectively gained 8%, Columbus gained 12%, and Indianapolis gained 14% over the same time period.
The 2009 population estimate from the US Census classifies population changes between natural population increases (number of births minus number of deaths) and net migration (the difference between people moving into the region minus those moving out of the region). Natural population increase contributes fundamentally all of Greater Cincinnati's population growth. A small amount of net international migration to the region is offset by a small amount of net domestic migration out of the region.[7]
The Cincinnati Metropolitan Statistical Area (MSA), which includes seven counties in Northern Kentucky and four in Southeast Indiana, is the largest metropolitan area that includes parts of Ohio, exceeding the population of Greater Cleveland, though both Greater Cleveland and metropolitan Columbus have larger populations within the state of Ohio as of 2013.
Most of the region's population growth has occurred in the northern counties, leading to speculation that the Cincinnati-Northern Kentucky metropolitan area will eventually merge with Greater Dayton.[8] Cincinnati is also located very close to other metropolitan areas, such as Louisville, Lexington, and Frankfort, Kentucky, and Columbus, Ohio.
Statistical information
| Statistical Area/County | 2020 Census | 2010 Census | 2000 Census | 1990 Census | 1980 Census | 1970 Census | 1960 Census | 1950 Census |
|---|---|---|---|---|---|---|---|---|
| Cincinnati-Wilmington-Maysville, OH-KY-IN CSA | 2,316,022 | 2,172,191 | 2,050,175 | 1,880,332 | 1,788,404 | 1,721,698 | 1,574,663 | 1,270,310 |
| Cincinnati, OH-KY-IN MSA | 2,256,884[9][better source needed] | 2,130,151 | 2,009,632 | 1,844,917 | 1,753,801 | 1,690,234 | 1,544,659 | 1,244,738 |
| Hamilton County, Ohio | 830,639 | 802,374 | 845,303 | 866,228 | 873,224 | 924,018 | 864,121 | 723,952 |
| Butler County, Ohio2 | 390,357 | 368,130 | 332,807 | 291,479 | 258,787 | 226,207 | 199,076 | 147,203 |
| Warren County, Ohio | 242,337 | 212,693 | 158,383 | 113,909 | 99,276 | 84,925 | 65,711 | 38,505 |
| Clermont County, Ohio | 208,601 | 197,363 | 177,977 | 150,187 | 128,483 | 95,725 | 80,530 | 42,182 |
| Brown County, Ohio | 43,676 | 44,846 | 42,285 | 34,966 | 31,920 | 26,635 | 25,178 | 22,221 |
| Clinton County, Ohio | 42,018 | |||||||
| Boone County, Kentucky | 135,968 | 118,811 | 85,991 | 57,589 | 45,842 | 32,812 | 21,940 | 13,015 |
| Kenton County, Kentucky | 169,064 | 159,720 | 151,464 | 142,031 | 137,058 | 129,440 | 120,700 | 104,254 |
| Campbell County, Kentucky | 93,076 | 90,336 | 88,616 | 83,866 | 83,317 | 88,501 | 86,803 | 76,196 |
| Grant County, Kentucky | 24,941 | 24,662 | 22,384 | 15,737 | 13,308 | 9,999 | 9,489 | 9,809 |
| Pendleton County, Kentucky | 14,644 | 14,877 | 14,390 | 12,036 | 10,989 | 9,949 | 9,968 | 9,610 |
| Bracken County, Kentucky | 8,400 | 8,488 | 8,279 | 7,766 | 7,738 | 7,227 | 7,422 | 8,424 |
| Gallatin County, Kentucky | 8,690 | 8,589 | 7,870 | 5,393 | 4,842 | 4,134 | 3,867 | 3,969 |
| Mason County, Kentucky | 17,120 | |||||||
| Dearborn County, Indiana | 50,679 | 50,047 | 46,109 | 38,835 | 34,291 | 29,430 | 28,674 | 25,141 |
| Franklin County, Indiana | 22,785 | 23,087 | 22,151 | 19,580 | 19,612 | 16,943 | 17,015 | 16,034 |
| Ohio County, Indiana | 5,940 | 6,128 | 5,623 | 5,315 | 5,114 | 4,289 | 4,165 | 4,223 |
| Union County, Indiana | 7,087 |
Notes
1For comparison purposes, population data is summarized using 2008 Census CSA/MSA county definitions.
2Butler County, Ohio was previously known as the Hamilton–Middletown, OH PMSA and was separate from the Cincinnati, OH–KY–IN PMSA until the 1990 Census, when the Cincinnati–Hamilton, OH–KY–IN CMSA designation was used to consolidate the two PMSAs. The CMSA/PMSA designation is no longer used by the US Census.
Counties
Cincinnati, OH–KY–IN MSA
- Brown County, Ohio
- Butler County, Ohio
- Clermont County, Ohio
- Hamilton County, Ohio
- Warren County, Ohio
- Boone County, Kentucky
- Bracken County, Kentucky
- Campbell County, Kentucky
- Gallatin County, Kentucky
- Grant County, Kentucky
- Kenton County, Kentucky
- Pendleton County, Kentucky
- Dearborn County, Indiana
- Franklin County, Indiana
- Ohio County, Indiana
- Union County, Indiana
Maysville, KY μSA
Wilmington, OH μSA
Main cities
In order of 2010 census population:
- Cincinnati, Ohio (298,843)
- Hamilton, Ohio (62,447)
- Middletown, Ohio (48,694)
- Fairfield, Ohio (42,510)
- Covington, Kentucky (40,640)
- Mason, Ohio (30,712)
- Florence, Kentucky (29,951)
- Independence, Kentucky (24,757)
- Oxford, Ohio (21,943)
- Lebanon, Ohio (20,033)
- Norwood, Ohio (19,207)
- Springboro, Ohio (18,931)
- Forest Park, Ohio (18,720)
- Erlanger, Kentucky (18,368)
- Fort Thomas, Kentucky (16,325)
- Newport, Kentucky (15,273)
- Sharonville, Ohio (13,560)
- Blue Ash, Ohio (12,114)
- Wilmington, Ohio (12,520) (CSA Only)
- Loveland, Ohio (12,081)
- Springdale, Ohio (11,223)
- Maysville, Kentucky (9,011) (CSA Only)
 Cincinnati, Ohio
 Covington, Kentucky
 Lebanon, Ohio
 Loveland, Ohio


Major highways and roads
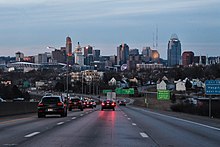
Interstate 71/Interstate 75 heading northbound into Cincinnati, Ohio from Covington, Kentucky  Interstate 71
 Interstate 74
 Interstate 75
 Interstate 275
 Interstate 471
 U.S. Route 22 & State Route 3 (Montgomery Road)
 U.S. Route 27 (Colerain Avenue)
 U.S. Route 42 (Reading Road, Lebanon Road)
 U.S. Route 50 (Columbia Parkway, Ohio Pike)
 U.S. Route 52 (Riverside Drive, Kellogg Avenue)
 U.S. Route 127 (Hamilton Avenue)
 Ohio State Route 4 (Springfield Pike, Dixie Highway)
 Ohio State Route 28
 Ohio State Route 32
 Ohio State Route 126 (Ronald Reagan Cross County Highway)
 Ohio State Route 129 (Butler County Veterans Highway)
 Ohio State Route 131
 Ohio State Route 562 (Norwood Lateral)
 Ohio State Route 747 (Princeton Pike)
 Kentucky Route 9 (AA Highway)
 Kentucky Route 17 (Madison Pike)
 Kentucky Route 18 (Burlington Pike)
 Kentucky Route 177 (Decoursey Pike)
- Vine Street, Cincinnati

Universities, colleges, and technical schools
Ohio
- University of Cincinnati
- Xavier University
- Cincinnati State Technical and Community College
- Miami University
- Mount St. Joseph University
- Union Institute & University
- Hebrew Union College
- Art Academy of Cincinnati
- God's Bible School and College
Kentucky
- Northern Kentucky University
- Thomas More University
- Gateway Community and Technical College
- Maysville Community and Technical College
Indiana
- Ivy Tech Community College
 University of Cincinnati
 Miami University
 Northern Kentucky University
 Art Academy of Cincinnati


Area codes
- 513 – Ohio Counties
- 937 and 326 – Ohio Counties
- 859 – most Kentucky counties
- 606 – Bracken and Mason Counties, Kentucky
- 812 and 930 – Indiana Counties
- 765 – Indiana Counties
Climate
The Cincinnati–Northern Kentucky metropolitan area is located within a climatic transition zone. The southern area of the region, from roughly about the Ohio River, is at the extreme northern limit of the humid subtropical climate; the north part of the region is on the extreme southern cusp of the humid continental climate. Evidence of both humid subtropical climate and humid continental climate can be found here, particularly noticeable by the presence of plants indicative of each climatic region. Within the area, the USDA climate zone rating can vary from as warm as zone 6b[10] to as cool as zone 5b,[11] with the warmest areas tending to be found closest to the Ohio River; individual microclimates of even cooler and warmer temperature may occur in the area but are too small to be considered in the overall climate zone rating. The common wall lizard, introduced from Italy in the 1950s, is an example of fauna in the area that lends a subtropical ambiance to the urban core (near downtown Cincinnati) area of the region.
Significant moderating variables for the overall climate are:
- South and central: Ohio River, Licking River, relatively large hills and valleys, and a combined urban heat island effect due to the close proximity of the Cincinnati-Northern Kentucky cities of Covington, Newport, and Downtown Cincinnati
- Suburban: large parking lots that take up much land in Mason, West Chester, and Florence create a heat island effect.
- North: Great Miami River, the area is situated on a glaciated flat plateau, the Miami Valley, and some urban heat island effect in the immediate area of downtown Dayton and Hamilton.

Traveling through the region from North to South, a subtle but interesting change in climate can be observed and is most evidenced by the gradual increase in the occurrence of subtropical indicator plants in the landscape. Most noticeable are the Southern Magnolia and Mimosa trees, and the needle palm also may be found as a winter hardy landscape specimen in lawns near the Ohio River. During the winter, travellers from north to south will routinely observe a significant difference in snowfall/ice/rain in the region.
Although widely accepted as part of the Midwest, the Cincinnati–Northern Kentucky metropolitan area is climatically and geographically located on the northern periphery of the Upland South region of the United States and is within the Bluegrass region of Ohio and Kentucky.
The area is vulnerable to occasional severe weather—thunderstorms, large hail and sometimes tornadoes.
| Climate data for Cincinnati (Cincinnati/Northern Kentucky Int'l), 1991–2020 normals,[lower-alpha 1] extremes 1871–present[lower-alpha 2] | |||||||||||||
|---|---|---|---|---|---|---|---|---|---|---|---|---|---|
| Month | Jan | Feb | Mar | Apr | May | Jun | Jul | Aug | Sep | Oct | Nov | Dec | Year |
| Record high °F (°C) | 77 (25) |
79 (26) |
88 (31) |
90 (32) |
95 (35) |
102 (39) |
108 (42) |
103 (39) |
102 (39) |
95 (35) |
82 (28) |
75 (24) |
108 (42) |
| Mean maximum °F (°C) | 62 (17) |
66 (19) |
74 (23) |
81 (27) |
87 (31) |
92 (33) |
94 (34) |
93 (34) |
91 (33) |
83 (28) |
72 (22) |
64 (18) |
95 (35) |
| Average high °F (°C) | 39.6 (4.2) |
43.7 (6.5) |
53.5 (11.9) |
65.5 (18.6) |
74.5 (23.6) |
82.6 (28.1) |
86.0 (30.0) |
85.2 (29.6) |
78.9 (26.1) |
66.7 (19.3) |
53.8 (12.1) |
43.3 (6.3) |
64.4 (18.0) |
| Daily mean °F (°C) | 31.4 (−0.3) |
34.7 (1.5) |
43.6 (6.4) |
54.6 (12.6) |
64.1 (17.8) |
72.3 (22.4) |
75.9 (24.4) |
74.9 (23.8) |
68.1 (20.1) |
56.2 (13.4) |
44.4 (6.9) |
35.6 (2.0) |
54.7 (12.6) |
| Average low °F (°C) | 23.1 (−4.9) |
25.8 (−3.4) |
33.8 (1.0) |
43.7 (6.5) |
53.7 (12.1) |
62.1 (16.7) |
65.9 (18.8) |
64.6 (18.1) |
57.3 (14.1) |
45.7 (7.6) |
35.1 (1.7) |
27.9 (−2.3) |
44.9 (7.2) |
| Mean minimum °F (°C) | 0 (−18) |
7 (−14) |
15 (−9) |
27 (−3) |
37 (3) |
49 (9) |
56 (13) |
55 (13) |
42 (6) |
30 (−1) |
19 (−7) |
9 (−13) |
−3 (−19) |
| Record low °F (°C) | −25 (−32) |
−17 (−27) |
−11 (−24) |
15 (−9) |
27 (−3) |
39 (4) |
47 (8) |
43 (6) |
31 (−1) |
16 (−9) |
0 (−18) |
−20 (−29) |
−25 (−32) |
| Average precipitation inches (mm) | 3.30 (84) |
3.17 (81) |
4.16 (106) |
4.53 (115) |
4.67 (119) |
4.75 (121) |
3.83 (97) |
3.43 (87) |
3.11 (79) |
3.35 (85) |
3.23 (82) |
3.73 (95) |
45.26 (1,150) |
| Average snowfall inches (cm) | 7.7 (20) |
6.7 (17) |
3.4 (8.6) |
0.4 (1.0) |
0.0 (0.0) |
0.0 (0.0) |
0.0 (0.0) |
0.0 (0.0) |
0.0 (0.0) |
0.2 (0.51) |
0.8 (2.0) |
4.1 (10) |
23.3 (59) |
| Average precipitation days (≥ 0.01 in) | 13.2 | 12.0 | 12.5 | 13.1 | 13.5 | 11.8 | 11.0 | 8.9 | 8.3 | 8.7 | 10.3 | 12.4 | 135.7 |
| Average snowy days (≥ 0.1 in) | 6.7 | 5.9 | 2.7 | 0.6 | 0.0 | 0.0 | 0.0 | 0.0 | 0.0 | 0.1 | 1.1 | 4.6 | 21.7 |
| Average relative humidity (%) | 72.2 | 70.1 | 67.0 | 62.8 | 66.9 | 69.2 | 71.5 | 72.3 | 72.7 | 69.2 | 71.0 | 73.8 | 69.9 |
| Average dew point °F (°C) | 19.9 (−6.7) |
22.5 (−5.3) |
31.3 (−0.4) |
39.6 (4.2) |
50.5 (10.3) |
59.7 (15.4) |
64.2 (17.9) |
63.0 (17.2) |
56.7 (13.7) |
43.7 (6.5) |
34.7 (1.5) |
25.5 (−3.6) |
42.6 (5.9) |
| Mean monthly sunshine hours | 120.8 | 128.4 | 170.1 | 211.0 | 249.9 | 275.5 | 277.0 | 261.5 | 234.4 | 188.8 | 118.7 | 99.3 | 2,335.4 |
| Percent possible sunshine | 40 | 43 | 46 | 53 | 56 | 62 | 61 | 62 | 63 | 55 | 39 | 34 | 52 |
| Average ultraviolet index | 2 | 3 | 5 | 6 | 8 | 9 | 9 | 8 | 7 | 4 | 2 | 2 | 5 |
| Source 1: NOAA (relative humidity and sun 1961–1990)[12][13][14][15] | |||||||||||||
| Source 2: Weather Atlas (UV)[16] | |||||||||||||
In media
Cincinnati-based broadcast media outlets often use the terms "Greater Cincinnati" and "Tri-State Area" to refer to their broader viewing or listening areas, especially for the purpose of weather reports or school closings. The viewing areas of WLWT, WCPO-TV, and WKRC-TV all span the same 26 counties, including Adams and Highland counties in Ohio; Fayette, Ripley, Switzerland, and Union counties in Indiana; and Carroll, Owen, and Robertson counties in Kentucky.[17][18][19] WXIX-TV additionally includes Decatur County in Indiana and Lewis County in Kentucky.[20]
Dayton-area media outlets similarly refer to a Miami Valley area that includes Butler and Warren counties in Ohio and sometimes Clinton County, Ohio, and Union County, Indiana.
Notes
- Mean monthly maxima and minima (i.e. the expected highest and lowest temperature readings at any point during the year or given month) calculated based on data at said location from 1991 to 2020.
- Official records for Cincinnati kept at downtown from January 1871 to March 1915, at the Cincinnati Abbe Observatory just north of downtown from April 1915 to March 1947, and at KCVG near Hebron, Kentucky since April 1947. For more information, see Threadex and History of Weather Observations Cincinnati, Ohio 1789–1947.
References
- https://www.uc.edu/cdc/urban_database/citywide_regional/gallis_report.pdf [bare URL PDF]
- "Census 2020: Cincy in a growth spurt; region gains 33 people every day".
- "Total Real Gross Domestic Product for Cincinnati, OH-KY-IN (MSA)". Federal Reserve Bank of St. Louis. January 2001.
- Table of United States Metropolitan Statistical Areas
- "Population Estimates". Retrieved 2016-02-11.
- "OMB Bulletin No. 18-04" (PDF) (Press release). Office of Management and Budget. September 2018. p. 47.
- Population Estimates
- "Ready for 'Daytonnati?' It could happen". Cincinnati.bizjournals.com. 1998-11-09. Retrieved 2012-05-14.
- "Census 2020: Cincy in a growth spurt; region gains 33 people every day".
- "Archived copy" (PDF). Archived from the original (PDF) on March 20, 2009. Retrieved May 28, 2009.
{{cite web}}: CS1 maint: archived copy as title (link) - Ramon Jordan (2012-01-24). "National Arboretum – USDA Plant Hardiness Zone Map". Usna.usda.gov. Archived from the original on 2012-07-04. Retrieved 2016-05-25.
- "NowData—NOAA Online Weather Data". National Oceanic and Atmospheric Administration. Retrieved May 9, 2021.
- "Station: Cincinnati Northern KY AP, KY". U.S. Climate Normals 2020: U.S. Monthly Climate Normals (1991-2020). National Oceanic and Atmospheric Administration. Retrieved May 9, 2021.
- "Records for Cincinnati". National Weather Service. Retrieved April 13, 2012.
- "WMO Climate Normals for CINCINNATI/GREATER CINCINNATI,KY 1961–1990". National Oceanic and Atmospheric Administration. Retrieved July 25, 2020.
- "Cincinnati, Ohio, USA - Monthly weather forecast and Climate data". Weather Atlas. Retrieved July 4, 2019.
- Rogers, Allison (January 12, 2019). "Winter weather update: Snow mixing with rain for some". WLWT. Hearst Television. Retrieved April 17, 2019.
- "Maps". WCPO-TV. E. W. Scripps Company. Retrieved April 17, 2019.
- "Cincinnati Maps". WKRC-TV. Sinclair Broadcast Group. Retrieved April 17, 2019.
- "Weather". WXIX-TV. Gray Television.
External links
| |||||||||||||
| Neighborhoods |
|  | |||||||||||
| History |
| ||||||||||||
| Culture |
| ||||||||||||
| Sports |
| ||||||||||||
| Education |
| ||||||||||||
| Transportation |
| ||||||||||||
State of Indiana | |
|---|---|
Indianapolis (capital) | |
| Topics |
|
| Government |
|
| Society |
|
| Largest cities |
|
| Largest towns |
|
| Counties |
|
| Regions |
|
Great Lakes megalopolis as defined by the RPA | ||
|---|---|---|
Includes all metropolitan areas that have a population of 150,000 or greater according to the most recent national census. | ||
| Great Lakes region cities |
|  |
| Surrounding cities |
| |
| Cities of states south of region | ||
| Other metro-regions |
| |
Other megaregions | ||
Другой контент может иметь иную лицензию. Перед использованием материалов сайта WikiSort.org внимательно изучите правила лицензирования конкретных элементов наполнения сайта.
WikiSort.org - проект по пересортировке и дополнению контента Википедии