world.wikisort.org - Philippines
Lazi, officially the Municipality of Lazi (Cebuano: Lungsod sa Lazi; Tagalog: Bayan ng Lazi), is a 4th class municipality in the province of Siquijor, Philippines. According to the 2020 census, it has a population of 22,488 people. [3]
Lazi | |
|---|---|
Municipality | |
| Municipality of Lazi | |
 Lazi municipal hall | |
 Seal | |
 Map of Siquijor with Lazi highlighted | |
OpenStreetMap  | |
 Lazi Location within the Philippines | |
| Coordinates: 9°07′41″N 123°38′02″E | |
| Country | Philippines |
| Region | Central Visayas |
| Province | Siquijor |
| District | Lone district |
| Founded | 1857 |
| Barangays | 18 (see Barangays) |
| Government | |
| • Type | Sangguniang Bayan |
| • Mayor | Phil Moore D. Largo (PDPLBN) |
| • Vice Mayor | Rose Mae B. Dalaygon (PDPLBN) |
| • Representative | Zaldy S. Villa |
| • Municipal Council | Members |
| • Electorate | 15,827 voters (2019) |
| Area | |
| • Total | 70.64 km2 (27.27 sq mi) |
| Elevation | 28 m (92 ft) |
| Highest elevation | 599 m (1,965 ft) |
| Lowest elevation | 0 m (0 ft) |
| Population | |
| • Total | 22,488 |
| • Density | 320/km2 (820/sq mi) |
| • Households | 5,001 |
| Economy | |
| • Income class | 4th municipal income class |
| • Poverty incidence | 20.30% (2018)[4] |
| • Revenue | ₱142,831,011.66 (2020) |
| • Assets | ₱287,836,399.63 (2020) |
| • Expenditure | ₱109,024,604.07 (2020) |
| • Liabilities | ₱51,519,556.89 (2020) |
| Service provider | |
| • Electricity | Province of Siquijor Electric Cooperative (PROSIELCO) |
| Time zone | UTC+8 (PST) |
| ZIP code | 6228 |
| PSGC | |
| IDD : area code | +63 (0)35 |
| Native languages | Cebuano Tagalog |
Lazi Church is currently in the tentative list for UNESCO World Heritage Sites under the Baroque Churches of the Philippines (Extension). A proposal has been suggested by scholars to make a separate UNESCO inclusion for "Old Centre of Lazi which includes the Lazi Church".
Geography
Barangays
Lazi comprises 18 barangays:
| PSGC | Barangay | Population | ±% p.a. | |||
|---|---|---|---|---|---|---|
| 2020 [3] | 2010 [5] | |||||
| 076103001 | Campalanas | 8.8% | 1,979 | 1,873 | 0.53% | |
| 076103002 | Cangclaran | 2.4% | 539 | 533 | 0.11% | |
| 076103003 | Cangomantong | 4.8% | 1,088 | 924 | 1.58% | |
| 076103004 | Capalasanan | 5.1% | 1,145 | 1,214 | −0.56% | |
| 076103005 | Catamboan (Poblacion) | 7.3% | 1,633 | 1,617 | 0.09% | |
| 076103006 | Gabayan | 8.8% | 1,970 | 1,934 | 0.18% | |
| 076103007 | Kimba | 3.2% | 725 | 657 | 0.95% | |
| 076103008 | Kinamandagan | 4.4% | 992 | 922 | 0.70% | |
| 076103009 | Lower Cabangcalan | 4.2% | 952 | 866 | 0.91% | |
| 076103010 | Nagerong | 6.0% | 1,346 | 1,313 | 0.24% | |
| 076103011 | Po‑o | 3.1% | 704 | 711 | −0.09% | |
| 076103012 | Simacolong | 7.9% | 1,777 | 1,801 | −0.13% | |
| 076103013 | Tagmanocan | 4.1% | 927 | 853 | 0.80% | |
| 076103014 | Talayong | 2.8% | 634 | 608 | 0.40% | |
| 076103015 | Tigbawan (Poblacion) | 7.1% | 1,605 | 1,696 | −0.53% | |
| 076103016 | Tignao | 4.1% | 914 | 887 | 0.29% | |
| 076103017 | Upper Cabangcalan | 2.8% | 631 | 658 | −0.40% | |
| 076103018 | Ytaya | 4.1% | 929 | 957 | −0.28% | |
| Total | 22,488 | 20,024 | 1.12% | |||
Climate
| Climate data for Lazi, Siquijor | |||||||||||||
|---|---|---|---|---|---|---|---|---|---|---|---|---|---|
| Month | Jan | Feb | Mar | Apr | May | Jun | Jul | Aug | Sep | Oct | Nov | Dec | Year |
| Average high °C (°F) | 29 (84) |
30 (86) |
31 (88) |
32 (90) |
31 (88) |
30 (86) |
30 (86) |
30 (86) |
30 (86) |
29 (84) |
29 (84) |
29 (84) |
30 (86) |
| Average low °C (°F) | 22 (72) |
22 (72) |
22 (72) |
23 (73) |
24 (75) |
24 (75) |
24 (75) |
24 (75) |
24 (75) |
24 (75) |
23 (73) |
23 (73) |
23 (74) |
| Average precipitation mm (inches) | 26 (1.0) |
22 (0.9) |
28 (1.1) |
41 (1.6) |
95 (3.7) |
136 (5.4) |
147 (5.8) |
126 (5.0) |
132 (5.2) |
150 (5.9) |
98 (3.9) |
46 (1.8) |
1,047 (41.3) |
| Average rainy days | 7.5 | 6.7 | 8.9 | 10.4 | 21.6 | 25.6 | 26.3 | 25.0 | 24.1 | 26.2 | 19.2 | 12.1 | 213.6 |
| Source: Meteoblue[6] | |||||||||||||
Demographics
| Year | Pop. | ±% p.a. |
|---|---|---|
| 1903 | 9,658 | — |
| 1918 | 13,161 | +2.08% |
| 1939 | 15,157 | +0.67% |
| 1948 | 13,840 | −1.00% |
| 1960 | 13,288 | −0.34% |
| 1970 | 14,875 | +1.13% |
| 1975 | 16,049 | +1.54% |
| 1980 | 16,149 | +0.12% |
| 1990 | 16,672 | +0.32% |
| 1995 | 16,339 | −0.38% |
| 2000 | 18,314 | +2.48% |
| 2007 | 19,440 | +0.83% |
| 2010 | 20,024 | +1.08% |
| 2015 | 20,490 | +0.44% |
| 2020 | 22,488 | +1.85% |
| Source: Philippine Statistics Authority [7] [5] [8][9] | ||
Economy
Gallery
 San Isidro Labrador Convent
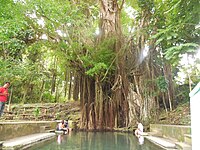 The century-old Enchanted Balete Tree
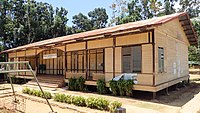 The wooden Gabaldon school
 Cambugahay Falls


References
- Municipality of Lazi | (DILG)
- "2015 Census of Population, Report No. 3 – Population, Land Area, and Population Density" (PDF). Philippine Statistics Authority. Quezon City, Philippines. August 2016. ISSN 0117-1453. Archived (PDF) from the original on May 25, 2021. Retrieved July 16, 2021.
- Census of Population (2020). "Region VII (Central Visayas)". Total Population by Province, City, Municipality and Barangay. PSA. Retrieved 8 July 2021.
- "PSA Releases the 2018 Municipal and City Level Poverty Estimates". Philippine Statistics Authority. 15 December 2021. Retrieved 22 January 2022.
- Census of Population and Housing (2010). "Region VII (Central Visayas)". Total Population by Province, City, Municipality and Barangay. NSO. Retrieved 29 June 2016.
- "Lazi: Average Temperatures and Rainfall". Meteoblue. Retrieved 28 April 2020.
- Census of Population (2015). "Region VII (Central Visayas)". Total Population by Province, City, Municipality and Barangay. PSA. Retrieved 20 June 2016.
- Censuses of Population (1903–2007). "Region VII (Central Visayas)". Table 1. Population Enumerated in Various Censuses by Province/Highly Urbanized City: 1903 to 2007. NSO.
- "Province of Siquijor". Municipality Population Data. Local Water Utilities Administration Research Division. Retrieved 17 December 2016.
- "Poverty incidence (PI):". Philippine Statistics Authority. Retrieved 28 December 2020.
- https://psa.gov.ph/sites/default/files/NSCB_LocalPovertyPhilippines_0.pdf; publication date: 29 November 2005; publisher: Philippine Statistics Authority.
- https://psa.gov.ph/sites/default/files/2003%20SAE%20of%20poverty%20%28Full%20Report%29_1.pdf; publication date: 23 March 2009; publisher: Philippine Statistics Authority.
- https://psa.gov.ph/sites/default/files/2006%20and%202009%20City%20and%20Municipal%20Level%20Poverty%20Estimates_0_1.pdf; publication date: 3 August 2012; publisher: Philippine Statistics Authority.
- https://psa.gov.ph/sites/default/files/2012%20Municipal%20and%20City%20Level%20Poverty%20Estima7tes%20Publication%20%281%29.pdf; publication date: 31 May 2016; publisher: Philippine Statistics Authority.
- https://psa.gov.ph/sites/default/files/City%20and%20Municipal-level%20Small%20Area%20Poverty%20Estimates_%202009%2C%202012%20and%202015_0.xlsx; publication date: 10 July 2019; publisher: Philippine Statistics Authority.
- "PSA Releases the 2018 Municipal and City Level Poverty Estimates". Philippine Statistics Authority. 15 December 2021. Retrieved 22 January 2022.
External links
 Media related to Lazi at Wikimedia Commons
- Lazi Profile at PhilAtlas.com
- Philippine Standard Geographic Code
This article about a location in Central Visayas region of the Philippines is a stub. You can help Wikipedia by expanding it. |
На других языках
[de] Lazi (Siquijor)
Lazi ist eine philippinische Stadtgemeinde in der Provinz Siquijor. Sie hat 20.490 Einwohner (Zensus 1. August 2015). In Lazi steht der Kirchenkomplex San Isidro Labrador, der seit 2006 auf der Vorschlagsliste der Philippinen zur Aufnahme zum Welterbeliste der UNESCO steht.- [en] Lazi, Siquijor
Текст в блоке "Читать" взят с сайта "Википедия" и доступен по лицензии Creative Commons Attribution-ShareAlike; в отдельных случаях могут действовать дополнительные условия.
Другой контент может иметь иную лицензию. Перед использованием материалов сайта WikiSort.org внимательно изучите правила лицензирования конкретных элементов наполнения сайта.
Другой контент может иметь иную лицензию. Перед использованием материалов сайта WikiSort.org внимательно изучите правила лицензирования конкретных элементов наполнения сайта.
2019-2025
WikiSort.org - проект по пересортировке и дополнению контента Википедии
WikiSort.org - проект по пересортировке и дополнению контента Википедии