world.wikisort.org - USA
Texas's 9th congressional district of the United States House of Representatives includes the southwestern portion of the Greater Houston area in Texas. The current Representative for the district, since 2005, is Democrat Al Green.
| Texas's 9th congressional district | |||
|---|---|---|---|
 Texas's 9th congressional district since January 3, 2013 | |||
| Representative |
| ||
| Distribution |
| ||
| Population (2021) | 765,427[2] | ||
| Median household income | $49,454[3] | ||
| Ethnicity |
| ||
| Cook PVI | D+29[4] | ||
From 1967 to 2005, the 9th covered an area stretching from Galveston through Houston to Beaumont. Much of that area is now the 2nd district. Most of the area now in the 9th was in the 25th district from 1983 to 2005.
List of members representing the district
| Member | Party | Term | Cong ess |
Electoral history |
|---|---|---|---|---|
| District created March 4, 1883 | ||||
 Roger Q. Mills |
Democratic | March 4, 1883 – March 23, 1892 |
48th 49th 50th 51st 52nd |
Redistricted from the 4th district and re-elected in 1882. Re-elected in 1884. Re-elected in 1886. Re-elected in 1888. Re-elected in 1890. Resigned when elected U.S. senator. |
| Vacant | March 23, 1892 – June 14, 1892 |
52nd | ||
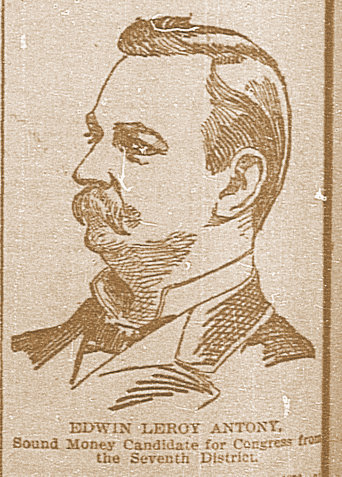 Edwin Le Roy Antony |
Democratic | June 14, 1892 – March 3, 1893 |
Elected to finish Mills's term. [data unknown/missing] | |
 Joseph D. Sayers |
Democratic | March 4, 1893 – January 16, 1899 |
53rd 54th 55th |
Redistricted from the 10th district and re-elected in 1892. Re-elected in 1894. Re-elected in 1896. Resigned when elected Governor of Texas. |
| Vacant | January 16, 1899 – March 3, 1899 |
55th | ||
 Albert S. Burleson |
Democratic | March 4, 1899 – March 3, 1903 |
56th 57th |
Elected in 1898. Re-elected in 1900. Redistricted to the 10th district. |
 George F. Burgess |
Democratic | March 4, 1903 – March 3, 1917 |
58th 59th 60th 61st 62nd 63rd 64th |
Redistricted from the 10th district and re-elected in 1902. Re-elected in 1904. Re-elected in 1906. Re-elected in 1908. Re-elected in 1910. Re-elected in 1912. Re-elected in 1914. [data unknown/missing] |
 Joseph J. Mansfield |
Democratic | March 4, 1917 – July 12, 1947 |
65th 66th 67th 68th 69th 70th 71st 72nd 73rd 74th 75th 76th 77th 78th 79th 80th |
Elected in 1916. Re-elected in 1918. Re-elected in 1920. Re-elected in 1922. Re-elected in 1924. Re-elected in 1926. Re-elected in 1928. Re-elected in 1930. Re-elected in 1932. Re-elected in 1934. Re-elected in 1936. Re-elected in 1938. Re-elected in 1940. Re-elected in 1942. Re-elected in 1944. Re-elected in 1946. Died. |
| Vacant | July 12, 1947 – August 23, 1947 |
80th | ||
 Clark W. Thompson |
Democratic | August 23, 1947 – December 30, 1966 |
80th 81st 82nd 83rd 84th 85th 86th 87th 88th 89th |
Elected to finish Mansfield's term. Re-elected in 1948. Re-elected in 1950. Re-elected in 1952. Re-elected in 1954. Re-elected in 1956. Re-elected in 1958. Re-elected in 1960. Re-elected in 1962. Re-elected in 1964. Resigned. |
| Vacant | December 30, 1966 – January 3, 1967 |
89th | ||
 Jack Brooks |
Democratic | January 3, 1967 – January 3, 1995 |
90th 91st 92nd 93rd 94th 95th 96th 97th 98th 99th 100th 101st 102nd 103rd |
Redistricted from the 2nd district and re-elected in 1966. Re-elected in 1968. Re-elected in 1970. Re-elected in 1972. Re-elected in 1974. Re-elected in 1976. Re-elected in 1978. Re-elected in 1980. Re-elected in 1982. Re-elected in 1984. Re-elected in 1986. Re-elected in 1988. Re-elected in 1990. Re-elected in 1992. [data unknown/missing] |
 Steve Stockman |
Republican | January 3, 1995 – January 3, 1997 |
104th | Elected in 1994. [data unknown/missing] |
 Nick Lampson |
Democratic | January 3, 1997 – January 3, 2005 |
105th 106th 107th 108th |
Elected in 1996. Re-elected in 1998. Re-elected in 2000. Re-elected in 2002. Redistricted to the 2nd district and lost re-election. |
 Al Green |
Democratic | January 3, 2005 – present |
109th 110th 111th 112th 113th 114th 115th 116th 117th |
Elected in 2004. Re-elected in 2006. Re-elected in 2008. Re-elected in 2010. Re-elected in 2012. Re-elected in 2014. Re-elected in 2016. Re-elected in 2018. Re-elected in 2020. Re-elected in 2022. |
Election results from presidential races
| Year | Office | Result |
|---|---|---|
| 2000 | President | Bush 53 - 44% |
| 2004 | President | Kerry 70 - 30% |
| 2008 | President | Obama 77 - 23% |
| 2012 | President | Obama 78 - 21% |
| 2016 | President | Clinton 79 - 18% |
| 2020 | President | Biden 76 - 23% |
Election results
| Party | Candidate | Votes | % | ±% | |
|---|---|---|---|---|---|
| Democratic | Al Green | 114,462 | 72.2 | +13.6 | |
| Republican | Arlette Molina | 42,132 | 26.6 | -13.7 | |
| Libertarian | Stacey Bourland | 1,972 | 1.2 | +0.2 | |
| Majority | 72,330 | 45.6 | |||
| Turnout | 158,566 | ||||
| Democratic hold | Swing | +13.7 | |||
| Party | Candidate | Votes | % | ±% | |
|---|---|---|---|---|---|
| Democratic | Al Green (incumbent) | 60,253 | 100 | +27.8 | |
| Majority | 60,253 | 100 | |||
| Turnout | 60,253 | ||||
| Democratic hold | Swing | +54.4 | |||
| Party | Candidate | Votes | % | ±% | |
|---|---|---|---|---|---|
| Democratic | Al Green (incumbent) | 143,868 | 93.65 | -6.35 | |
| Libertarian | Brad Walters | 9,760 | 6.35 | +6.35 | |
| Majority | 134,108 | 87.30 | -12.70 | ||
| Turnout | 153,628 | ||||
| Democratic hold | Swing | ||||
| Party | Candidate | Votes | % | ±% | |
|---|---|---|---|---|---|
| Democratic | Al Green (incumbent) | 80,107 | 75.74 | -17.91 | |
| Republican | Steve Mueller | 24,201 | 22.88 | +22.88 | |
| Libertarian | Michael W. Hope | 1,459 | 1.38 | -4.97 | |
| Majority | 55,906 | 52.86 | -34.44 | ||
| Turnout | 105,767 | ||||
| Democratic hold | Swing | ||||
| Party | Candidate | Votes | % | ±% | |
|---|---|---|---|---|---|
| Democratic | Al Green (incumbent) | 144,075 | 78.49 | +2.75 | |
| Republican | Steve Mueller | 36,139 | 19.69 | -3.19 | |
| Green | Vanessa Foster | 1,743 | 0.95 | +0.95 | |
| Libertarian | John Wieder | 1,609 | 0.88 | -0.50 | |
| Majority | 107,936 | 58.80 | +5.94 | ||
| Turnout | 183,566 | ||||
| Democratic hold | Swing | ||||
| Party | Candidate | Votes | % | ±% | |
|---|---|---|---|---|---|
| Democratic | Al Green (incumbent) | 78,109 | 90.82 | +12.33 | |
| Libertarian | Johnny Johnson | 7,894 | 9.18 | +8.30 | |
| Majority | 70,215 | 81.64 | +22.84 | ||
| Turnout | 86,003 | ||||
| Democratic hold | Swing | ||||
| Party | Candidate | Votes | % | ±% | |
|---|---|---|---|---|---|
| Democratic | Al Green (incumbent) | 152,032 | 80.64 | -10.18 | |
| Republican | Jeff Martin | 36,491 | 19.36 | +19.36 | |
| Majority | 115,541 | 61.28 | -20.36 | ||
| Turnout | 188,523 | ||||
| Democratic hold | Swing | ||||
| Party | Candidate | Votes | % | ±% | |
|---|---|---|---|---|---|
| Democratic | Al Green (incumbent) | 136,256 | 89.06 | +8.42 | |
| Libertarian | Phil Kurtz | 5,940 | 3.88 | +3.88 | |
| Independent | Benjamin Hernandez | 5,774 | 3.77 | +3.77 | |
| Independent | Kesha Rogers | 5,031 | 3.29 | +3.29 | |
| Majority | 130,316 | 85.18 | +23.90 | ||
| Turnout | 153,001 | ||||
| Democratic hold | Swing | ||||
| Party | Candidate | Votes | % | |
|---|---|---|---|---|
| Democratic | Al Green (incumbent) | 172,938 | 75.5 | |
| Republican | Johnny Teague | 49,575 | 21.6 | |
| Libertarian | Joe Sosa | 6,594 | 2.9 | |
| Total votes | 229,107 | 100.0 | ||
| Democratic hold | ||||
Historical district boundaries

2007 - 2013
From 1967 to 2005 the district included the Johnson Space Center, and from 1935 to 2005 it took in Galveston.
See also
- List of United States congressional districts
References
- "Congressional Districts Relationship Files (State-based)". U.S. Census Bureau. Archived from the original on April 2, 2013.
- "My Congressional District".
- "My Congressional District".
- "Partisan Voting Index – Districts of the 115th Congress" (PDF). The Cook Political Report. April 7, 2017. Retrieved April 7, 2017.
- "Texas Election Results - Official Results". Texas Secretary of State. Retrieved November 26, 2020.
- Martis, Kenneth C. (1989). The Historical Atlas of Political Parties in the United States Congress. New York: Macmillan Publishing Company.
- Martis, Kenneth C. (1982). The Historical Atlas of United States Congressional Districts. New York: Macmillan Publishing Company.
- Congressional Biographical Directory of the United States 1774–present
This United States Congress–related article is a stub. You can help Wikipedia by expanding it. |
Текст в блоке "Читать" взят с сайта "Википедия" и доступен по лицензии Creative Commons Attribution-ShareAlike; в отдельных случаях могут действовать дополнительные условия.
Другой контент может иметь иную лицензию. Перед использованием материалов сайта WikiSort.org внимательно изучите правила лицензирования конкретных элементов наполнения сайта.
Другой контент может иметь иную лицензию. Перед использованием материалов сайта WikiSort.org внимательно изучите правила лицензирования конкретных элементов наполнения сайта.
2019-2026
WikiSort.org - проект по пересортировке и дополнению контента Википедии
WikiSort.org - проект по пересортировке и дополнению контента Википедии