world.wikisort.org - USA
North Carolina's 12th congressional district is a congressional district located in the city of Charlotte and surrounding areas in Mecklenburg County represented by Democrat Alma Adams. Prior to the 2016 elections, it was a gerrymandered district located in central North Carolina that comprised portions of Charlotte, Winston-Salem, Greensboro, Lexington, Salisbury, Concord, and High Point.[4]
| North Carolina's 12th congressional district | |||
|---|---|---|---|
Interactive map of district boundaries. Red Line indicates Mecklenburg County and Cabarrus County (Only in 2023-5 Map). | |||
| Representative |
| ||
| Distribution |
| ||
| Population (2020) | 745,671[1] | ||
| Median household income | $61,658[2] | ||
| Ethnicity |
| ||
| Cook PVI | D+13[3] | ||
| Created | 1993 | ||


It was one of two minority-majority Congressional districts created in the state in the 1990s. Between 2003 and 2013, there was a small plurality of white Americans in the district according to the 2000 United States Census, although African Americans made up a comparable proportion of the voting population. As redrawn for the 2012 elections and under the lines used prior to the 2016 elections, the district had an African-American majority according to the 2010 United States Census. The 12th district is the most Democratic district in North Carolina, and it has never been represented by a Republican.
North Carolina had a twelfth seat in the House in the early nineteenth century (1803-1843) and in the mid-twentieth century (1943–1963). Most of the territory in the district's second incarnation is now in the 11th district.

Re-establishment from 1990
The district was re-established after the 1990 United States Census, when North Carolina gained a House seat due to an increase in population. It was drawn in 1992 as one of two minority-majority districts, designed to give African-American voters (who comprised 22% of the state's population at the time) the chance to elect a representative of their choice; Section 2 of the Voting Rights Act prohibited the dilution of voting power of minorities by distributing them among districts so that they could never elect candidates of their choice.[5]
In its original configuration, the district had a 64 percent African-American majority in population. The district boundaries, stretching from Gastonia to Durham, were so narrow at some points that it was no wider than a highway lane. It followed Interstate 85 almost exactly.[6][7] One state legislator famously remarked, after seeing the district map, "if you drove down the interstate with both car doors open, you’d kill most of the people in the district."[8][9]
The United States Supreme Court ruled in Shaw v. Reno (1993) that a racial gerrymander may, in some circumstances, violate the Equal Protection Clause of the United States Constitution.
The state legislature defended the two minority-majority districts as based on demographics, with the 12th representing people of the interior Piedmont area and the 1st the Coastal Plain.[5] Subsequently, the 12th district was redrawn several times and was adjudicated in the Supreme Court on two additional occasions.[5] The version created after the 2000 census was approved by the U.S. Supreme Court in Hunt v. Cromartie. The district's configuration dating from the 2000 census had a small plurality of whites, and it was changed only slightly after the 2010 census. African Americans make up a large majority of registered voters and Hispanics constitute 7.1% of residents.
On February 5, 2016, U.S. Circuit Judge Roger L. Gregory ruled that the district, along with North Carolina's 1st congressional district,[10] must be redrawn from its post-2010 configuration,[11] and that race could not be a mitigating factor in drawing the district.[12] This decision, in the case of Cooper v. Harris, was subsequently upheld 5−3 by the U.S. Supreme Court in an opinion by Justice Elena Kagan on May 22, 2017.[13] In the opinion, Justice Kagan noted that this marked the fifth time the 12th district had appeared before the Supreme Court, following Shaw v. Reno and Hunt v. Cromartie which had both been heard twice before the Court.[14]
In all of its configurations, it has been a Democratic stronghold. Its previous incarnation was dominated by black voters in Charlotte, Greensboro, and Winston-Salem. The redrawn map made the 12th a compact district comprising nearly all of Mecklenburg County, except the southeast quadrant. Due to Charlotte's heavy swing to the Democrats in recent years, the reconfigured 12th is no less Democratic than its predecessor.
On February 23, 2022, the North Carolina Supreme Court approved a new map which changed the 12th district boundaries to include the northern half of Mecklenburg County, including most of Uptown, along with eastern Cabarrus County.[15]
List of members representing the district
| Member | Party | Years | Cong ress |
Electoral history | District Location |
|---|---|---|---|---|---|
| District created March 4, 1803 | |||||
 Joseph Winston |
Democratic-Republican | March 4, 1803 – March 3, 1807 |
8th 9th |
Elected in 1803. Re-elected in 1804. Retired. |
1803–1813 "North Carolina Congressional District Map (1803-13)".[16] |
| Meshack Franklin | Democratic-Republican | March 4, 1807 – March 3, 1813 |
10th 11th 12th |
Elected in 1806. Re-elected in 1808. Re-elected in 1810. Redistricted to the 13th district. | |
| 1813–1823 [data unknown/missing] | |||||
 Israel Pickens |
Democratic-Republican | March 4, 1813 – March 3, 1817 |
13th 14th |
Redistricted from the 11th district and re-elected in 1813. Re-elected in 1815. Retired. | |
| Felix Walker | Democratic-Republican | March 4, 1817 – March 3, 1823 |
15th 16th 17th |
Elected in 1817. Re-elected in 1819. Re-elected in 1821. Lost re-election. | |
| Robert B. Vance | Democratic-Republican | March 4, 1823 – March 3, 1825 |
18th | Elected in 1823. Lost re-election. |
1823–1833 [data unknown/missing] |
 Samuel P. Carson |
Jacksonian | March 4, 1825 – March 3, 1833 |
19th 20th 21st 22nd |
Elected in 1825. Re-elected in 1827. Re-elected in 1829. Re-elected in 1831. [data unknown/missing] | |
 James Graham |
Anti-Jacksonian | March 4, 1833 – March 29, 1836 |
23rd 24th |
Elected in 1833. Re-elected in 1835. Seat declared vacant. |
1833–1843 [data unknown/missing] |
| Vacant | March 29, 1836 – December 5, 1836 |
24th | |||
James Graham |
Anti-Jacksonian | December 5, 1836 – March 3, 1837 |
24th 25th 26th 27th |
Elected in 1836 to finish his term. Also elected in 1837 to the next term. Re-elected in 1839. Re-elected in 1841. Redistricted to the 1st congressional district and lost re-election. | |
| Whig | March 4, 1837 – March 3, 1843 | ||||
| District eliminated March 4, 1843 | |||||
| District re-established January 3, 1943 | |||||
 Zebulon Weaver |
Democratic | January 3, 1943 – January 3, 1947 |
78th 79th |
Redistricted from the 11th congressional district and re-elected in 1942. Re-elected in 1944. Lost renomination. | |
| Monroe M. Redden | Democratic | January 3, 1947 – January 3, 1953 |
80th 81st 82nd |
Elected in 1946. Re-elected in 1948. Retired. | |
 George A. Shuford |
Democratic | January 3, 1953 – January 3, 1959 |
83rd 84th 85th |
Elected in 1952. Re-elected in 1954. Re-elected in 1956. Renominated but later withdrew because of ill health. | |
 David M. Hall |
Democratic | January 3, 1959 – January 29, 1960 |
86th | Elected in 1958. Died. | |
| Vacant | January 29, 1960 – June 25, 1960 |
||||
 Roy A. Taylor |
Democratic | June 25, 1960 – January 3, 1963 |
86th 87th |
Elected to finish Hall's term. Re-elected in 1960. Redistricted to the 11th district. | |
| District eliminated January 3, 1963 | |||||
| District re-established January 3, 1993 | |||||
 Mel Watt |
Democratic | January 3, 1993 – January 6, 2014 |
103rd 104th 105th 106th 107th 108th 109th 110th 111th 112th 113th |
Elected in 1992. Re-elected in 1994. Re-elected in 1996. Re-elected in 1998. Re-elected in 2000. Re-elected in 2002. Re-elected in 2004. Re-elected in 2006. Re-elected in 2008. Re-elected in 2010. Re-elected in 2012. Resigned to become Director of the Federal Housing Finance Agency. |
2003–2013 2003–2013 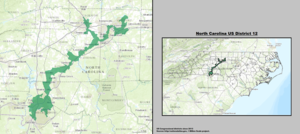 2013–2017  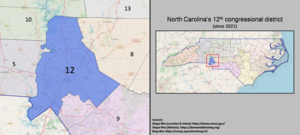 |
| Vacant | January 6, 2014 – November 4, 2014 |
113th | |||
 Alma Adams |
Democratic | November 4, 2014 – Present |
113th 114th 115th 116th 117th |
Elected to finish Watt's term. Also elected in 2014 to the next term. Re-elected in 2016. Re-elected in 2018. Re-elected in 2020. | |
Recent election results
2002
| Party | Candidate | Votes | % | ±% | |
|---|---|---|---|---|---|
| Democratic | Mel Watt (incumbent) | 98,821 | 65.34 | ||
| Republican | Jeff Kish | 49,588 | 32.79 | ||
| Libertarian | Carey Head | 2,830 | 1.87 | ||
| Turnout | 151,239 | 100.00 | |||
| Democratic hold | |||||
2004
| Party | Candidate | Votes | % | ±% | |
|---|---|---|---|---|---|
| Democratic | Mel Watt (incumbent) | 154,908 | 66.83 | +1.49 | |
| Republican | Ada Fisher | 76,898 | 33.17 | +0.39 | |
| Turnout | 231,806 | 100.00 | |||
| Democratic hold | |||||
2006
| Party | Candidate | Votes | % | ±% | |
|---|---|---|---|---|---|
| Democratic | Mel Watt (incumbent) | 71,345 | 67.01 | +0.18 | |
| Republican | Ada Fisher | 35,127 | 32.99 | –0.18 | |
| Turnout | 106,472 | 100.00 | |||
| Democratic hold | |||||
2008
| Party | Candidate | Votes | % | ±% | |
|---|---|---|---|---|---|
| Democratic | Mel Watt (incumbent) | 215,908 | 71.56 | +4.55 | |
| Republican | Ty Cobb, Jr. | 85,814 | 28.44 | –4.55 | |
| Turnout | 301,722 | 100.00 | |||
| Democratic hold | |||||
2010
| Party | Candidate | Votes | % | |
|---|---|---|---|---|
| Democratic | Mel Watt (incumbent) | 103,495 | 63.88 | |
| Republican | Greg Dority | 55,315 | 34.14 | |
| Libertarian | Lon Cecil | 3,197 | 1.97 | |
| Total votes | 162,007 | 100.00 | ||
| Democratic hold | ||||
2012
| Party | Candidate | Votes | % | |
|---|---|---|---|---|
| Democratic | Melvin Watt (incumbent) | 247,591 | 79.6 | |
| Republican | Jack Brosch | 63,317 | 20.4 | |
| Total votes | 310,908 | 100.0 | ||
| Democratic hold | ||||
2014 (Special Election)
| Party | Candidate | Votes | % | ±% | |
|---|---|---|---|---|---|
| Democratic | Alma Adams | 127,668 | 75.43% | -4.20% | |
| Republican | Vince Coakley | 41,578 | 24.57% | +4.20% | |
| Total votes | 169,246 | 100.0% | N/A | ||
| Democratic hold | |||||
2014
| Party | Candidate | Votes | % | |
|---|---|---|---|---|
| Democratic | Alma Adams | 130,096 | 75.4 | |
| Republican | Vince Coakley | 42,568 | 24.6 | |
| Total votes | 172,664 | 100.0 | ||
| Democratic hold | ||||
2016
| Party | Candidate | Votes | % | |
|---|---|---|---|---|
| Democratic | Alma Adams (incumbent) | 234,115 | 67.0 | |
| Republican | Leon Threatt | 115,185 | 33.0 | |
| Total votes | 349,300 | 100.0 | ||
| Democratic hold | ||||
2018
| Party | Candidate | Votes | % | |
|---|---|---|---|---|
| Democratic | Alma Adams (incumbent) | 203,974 | 73.1 | |
| Republican | Paul Wright | 75,164 | 26.9 | |
| Total votes | 279,138 | 100.0 | ||
| Democratic hold | ||||
2020
| Party | Candidate | Votes | % | |
|---|---|---|---|---|
| Democratic | Alma Adams (incumbent) | 341,457 | 100.0 | |
| Total votes | 341,457 | 100.0 | ||
| Democratic hold | ||||
See also
- North Carolina's congressional districts
- List of United States congressional districts
References
- "NC 2022 Congressional". davesredistricting.org. Retrieved June 17, 2022.
- Center for New Media & Promotion (CNMP), US Census Bureau. "My Congressional District". www.census.gov.
- "Enacted Maps and 2022 Ratings". The Cook Political Report. Retrieved June 17, 2021.
- "Congressional Districts Relationship Files (State-based)". U.S. Census Bureau. Archived from the original on April 2, 2013.
- senate.leg.state.mn.us "North Carolina Redistricting Cases: the 1990s" Archived March 9, 2008, at the Wayback Machine, National Conference of State Legislatures
- "Electoral Vote Reforms". politicsnj.com. Archived from the original on August 4, 2007.
- "State Profile -- North Carolina". CNN. Retrieved May 20, 2010.
- "Thomas right to oppose racial 'homelands'". The Item. August 17, 1994.
- "12th District's History, Future Will Be Getting More Attention". WFAE. May 15, 2013.
- Simpson, Ian (February 8, 2016). "Judges find two N. Carolina congressional districts racially gerrymandered". Reuters. Retrieved February 8, 2016.
- Choate, Paul (February 5, 2016). "Federal court invalidates maps of North Carolina's 1st, 12th congressional districts". High Point, NC: WGHP FOX8. Retrieved February 6, 2016.
- "Judges strike down 1st, 12th Districts". The Times-News. Burlington, NC. The Associated Press. February 6, 2016.
- Howe, Amy (May 22, 2017). "Opinion analysis: Court strikes down N.C. districts in racial gerrymandering challenge". SCOTUSblog. Retrieved May 23, 2017.
- "Opinion of the Supreme Court" (PDF).
- Doule, Steve (February 23, 2022). "Check out new election maps: NC Supreme Court rejects appeals, approves special masters' districts". WGHP. Retrieved March 21, 2022.
- "Data Courtesy of Jeffrey B. Lewis, Brandon DeVine, and Lincoln Pritcher with Kenneth C. Martis". United States Congressional District Shapefiles.
- "2002 General Election Results US House (12th District)". North Carolina State Board of Elections. Archived from the original on July 18, 2011. Retrieved January 11, 2010.
- "2004 General Election Results US House (12th District)". North Carolina State Board of Elections. Retrieved January 11, 2010.[permanent dead link]
- "2006 General Election Results US House (12th District)". North Carolina State Board of Elections. Retrieved January 11, 2010.[permanent dead link]
- "2008 General Election". results.enr.clarityelections.com. Retrieved June 29, 2022.
- "US House of Representatives district 12". results.enr.clarityelections.com. Retrieved June 29, 2022.
- "North Carolina General Elections Results 2012". results.enr.clarityelections.com. Retrieved June 29, 2022.
- "NC SBE Contest Results".
- "11/04/2014 OFFICIAL GENERAL ELECTION RESULTS - STATEWIDE". ncsbe.gov/. Archived from the original on June 29, 2022. Retrieved June 29, 2022.
- "11/08/2016 OFFICIAL GENERAL ELECTION RESULTS - STATEWIDE". ncsbe.gov. Retrieved June 29, 2022.
- "District 12, North Carolina State Board of Elections & Ethics Enforcement". North Carolina State Board of Elections & Ethics Enforcement. Retrieved November 10, 2018.
- "November 03, 2020 General Election Results by Contest" (PDF). amazonaws.com. Retrieved June 29, 2022.
- Martis, Kenneth C. (1989). The Historical Atlas of Political Parties in the United States Congress. New York: Macmillan Publishing Company.
- Martis, Kenneth C. (1982). The Historical Atlas of United States Congressional Districts. New York: Macmillan Publishing Company.
- Congressional Biographical Directory of the United States 1774–present
External links
Другой контент может иметь иную лицензию. Перед использованием материалов сайта WikiSort.org внимательно изучите правила лицензирования конкретных элементов наполнения сайта.
WikiSort.org - проект по пересортировке и дополнению контента Википедии