world.wikisort.org - USA
The 25th congressional district of New York is a congressional district for the United States House of Representatives. It is currently represented by Democrat Joseph Morelle. The district is now located within Monroe County and part of Orleans County, centered on the city of Rochester. Since 2013, the 25th district has been located entirely within Monroe County, and includes the City of Rochester and surrounding suburbs.
| New York's 25th congressional district | |||
|---|---|---|---|
Interactive map of district boundaries, with Monroe County highlighted in red | |||
| Representative |
| ||
| Distribution |
| ||
| Population (2021) | 728,525 | ||
| Median household income | $65,502[1] | ||
| Ethnicity |
| ||
| Cook PVI | D+8[2] | ||


In the 2018 race, the seat was vacant. State Assembly Member Joseph Morelle (Democrat)[3] faced James Maxwell (Republican, Conservative, Reform),[4] in the general election, which Morelle won handily.[5]
Voting
| Year | Results |
|---|---|
| 1992 | Clinton 41 - 36% |
| 1996 | Clinton 51 - 38% |
| 2000 | Gore 51 - 45% |
| 2004 | Kerry 50 - 48% |
| 2008 | Obama 59 - 40% |
| 2012 | Obama 59 - 39% |
| 2016 | Clinton 56 - 39% |
| 2020 | Biden 60 - 37% |
History
Historically, most of this district was located in Upstate New York. In the 1960s, the 25th District was a Westchester/Rockland seat, covering areas now in the 17th and 18th Districts. In the 1970s it was the lower Hudson Valley district and congruent to the present 19th District. Onondaga County was split between the 32nd District (which included rural counties east of Syracuse now in the 23rd and 24th Districts) and the 33rd District (which included the Finger Lakes counties in the 24th and 29th Districts).
In the 1980s, the district was centered in the Utica area (now the 24th District), and the Syracuse area was entirely in the 27th District. From 2003 to 2013, it stretched from Syracuse to the northeastern suburbs of Rochester. The district comprised Onondaga and Wayne counties, the northernmost portion of Cayuga County, and the towns of Irondequoit, Penfield, and Webster in Monroe County. The district included 100 miles of Lake Ontario shoreline, the easternmost Finger Lakes, and significant portions of the Erie Canal.
List of members representing the district
| Member | Party | Years | Cong ress |
Electoral history | Location |
|---|---|---|---|---|---|
| District created March 4, 1823 | |||||
| Samuel Lawrence | Democratic-Republican | March 4, 1823 – March 3, 1825 |
18th | Elected in 1822. [data unknown/missing] |
1823–1833 Tioga and Tompkins counties |
Charles Humphrey |
Anti-Jacksonian | March 4, 1825 – March 3, 1827 |
19th | Elected in 1824. [data unknown/missing] | |
 David Woodcock |
Anti-Jacksonian | March 4, 1827 – March 3, 1829 |
20th | Elected in 1826. [data unknown/missing] | |
 Thomas Maxwell |
Jacksonian | March 4, 1829 – March 3, 1831 |
21st | Elected in 1828. [data unknown/missing] | |
 Gamaliel H. Barstow |
Anti-Masonic | March 4, 1831 – March 3, 1833 |
22nd | Elected in 1830. [data unknown/missing] | |
| Samuel Clark | Jacksonian | March 4, 1833 – March 3, 1835 |
23rd | Elected in 1832 [data unknown/missing] |
1833–1843 [data unknown/missing] |
| Graham H. Chapin | Jacksonian | March 4, 1835 – March 3, 1837 |
24th | Elected in 1834. [data unknown/missing] | |
 Samuel Birdsall |
Democratic | March 4, 1837 – March 3, 1839 |
25th | Elected in 1836. [data unknown/missing] | |
| Theron R. Strong | Democratic | March 4, 1839 – March 3, 1841 |
26th | Elected in 1838. [data unknown/missing] | |
| John Maynard | Whig | March 4, 1841 – March 3, 1843 |
27th | Elected in 1840. [data unknown/missing] | |
 George O. Rathbun |
Democratic | March 4, 1843 – March 3, 1847 |
28th 29th |
Elected in 1842. Re-elected in 1844. [data unknown/missing] |
1843–1853 [data unknown/missing] |
 Harmon S. Conger |
Whig | March 4, 1847 – March 3, 1851 |
30th 31st |
Elected in 1846. Re-elected in 1848. [data unknown/missing] | |
| Thomas Y. Howe Jr. | Democratic | March 4, 1851 – March 3, 1853 |
32nd | Elected in 1850. [data unknown/missing] | |
 Edwin B. Morgan |
Whig | March 4, 1853 – March 3, 1855 |
33rd 34th 35th |
Elected in 1852. [data unknown/missing] |
1853–1863 [data unknown/missing] |
| Opposition | March 4, 1855 – March 3, 1857 |
Re-elected in 1854. [data unknown/missing] | |||
| Republican | March 4, 1857 – March 3, 1859 |
Re-elected in 1856. [data unknown/missing] | |||
| Martin Butterfield | Republican | March 4, 1859 – March 3, 1861 |
36th | Elected in 1858. [data unknown/missing] | |
 Theodore M. Pomeroy |
Republican | March 4, 1861 – March 3, 1863 |
37th | Elected in 1860. Redistricted to the 24th district. | |
 Daniel Morris |
Republican | March 4, 1863 – March 3, 1867 |
38th 39th |
Elected in 1862. Re-elected in 1864. [data unknown/missing] |
1863–1873 [data unknown/missing] |
 William H. Kelsey |
Republican | March 4, 1867 – March 3, 1871 |
40th 41st |
Elected in 1866. Re-elected in 1868. [data unknown/missing] | |
 William H. Lamport |
Republican | March 4, 1871 – March 3, 1873 |
42nd | Elected in 1870. Redistricted to the 26th district. | |
 Clinton D. MacDougall |
Republican | March 4, 1873 – March 3, 1875 |
43rd | Elected in 1872. Redistricted to the 26th district. |
1873–1883 [data unknown/missing] |
 Elias W. Leavenworth |
Republican | March 4, 1875 – March 3, 1877 |
44th | Elected in 1874. [data unknown/missing] | |
 Frank Hiscock |
Republican | March 4, 1877 – March 3, 1887 |
45th 46th 47th 48th 49th |
Elected in 1876. Re-elected in 1878. Re-elected in 1880. Re-elected in 1882. Re-elected in 1884. Re-elected in 1886. Resigned when elected U.S. senator. | |
| 1883–1893 [data unknown/missing] | |||||
| Vacant | March 3, 1887 – November 8, 1887 |
50th | |||
 James J. Belden |
Republican | November 8, 1887 – March 3, 1893 |
50th 51st 52nd |
Elected to finish Hiscock's term. Re-elected in 1888. Re-elected in 1890. Redistricted to the 27th district. | |
 James S. Sherman |
Republican | March 4, 1893 – March 3, 1903 |
53rd 54th 55th 56th 57th |
Elected in 1892. Re-elected in 1894. Re-elected in 1896. Re-elected in 1898. Re-elected in 1900. Redistricted to the 27th district. |
1893–1903 [data unknown/missing] |
 Lucius N. Littauer |
Republican | March 4, 1903 – March 3, 1907 |
58th 59th |
Redistricted from the 22nd district and re-elected in 1902. Re-elected in 1904. [data unknown/missing] |
1903–1913 [data unknown/missing] |
 Cyrus Durey |
Republican | March 4, 1907 – March 3, 1911 |
60th 61st |
Elected in 1906. Re-elected in 1908. [data unknown/missing] | |
 Theron Akin |
Progressive Republican | March 4, 1911 – March 3, 1913 |
62nd | Elected in 1910. [data unknown/missing] | |
 Benjamin I. Taylor |
Democratic | March 4, 1913 – March 3, 1915 |
63rd | Elected in 1912. [data unknown/missing] |
1913–1923 [data unknown/missing] |
 James W. Husted |
Republican | March 4, 1915 – March 3, 1923 |
64th 65th 66th 67th |
Elected in 1914. Re-elected in 1916. Re-elected in 1918. Re-elected in 1920. [data unknown/missing] | |
 J. Mayhew Wainwright |
Republican | March 4, 1923 – March 3, 1931 |
68th 69th 70th 71st |
Elected in 1922. Re-elected in 1924. Re-elected in 1926. Re-elected in 1928. [data unknown/missing] |
1923–1933 [data unknown/missing] |
 Charles D. Millard |
Republican | March 4, 1931 – September 29, 1937 |
72nd 73rd 74th 75th |
Elected in 1930. Re-elected in 1932. Re-elected in 1934. Re-elected in 1936. Resigned when elected surrogate of Westchester County | |
| 1933–1943 [data unknown/missing] | |||||
| Vacant | September 29, 1937 – November 2, 1937 |
75th | |||
 Ralph A. Gamble |
Republican | November 2, 1937 – January 3, 1945 |
75th 76th 77th 78th |
Elected to finish Millard's term Re-elected in 1938. Re-elected in 1940. Re-elected in 1942. Redistricted to the 28th district. | |
| 1943–1953 [data unknown/missing] | |||||
 Charles A. Buckley |
Democratic | January 3, 1945 – January 3, 1953 |
79th 80th 81st 82nd |
Redistricted from the 23rd district and re-elected in 1944. Re-elected in 1946. Re-elected in 1948. Re-elected in 1950. Redistricted to the 24th district. | |
 Paul A. Fino |
Republican | January 3, 1953 – January 3, 1963 |
83rd 84th 85th 86th 87th |
Elected in 1952. Re-elected in 1954. Re-elected in 1956. Re-elected in 1958. Re-elected in 1960. Redistricted to the 24th district. |
1953–1963 [data unknown/missing] |
 Robert R. Barry |
Republican | January 3, 1963 – January 3, 1965 |
88th | Redistricted from the 27th district and re-elected in 1962. [data unknown/missing] |
1963–1973 [data unknown/missing] |
 Richard Ottinger |
Democratic | January 3, 1965 – January 3, 1971 |
89th 90th 91st |
Elected in 1964. Re-elected in 1966. Re-elected in 1968. Retired to run for U.S. Senator. | |
 Peter A. Peyser |
Republican | January 3, 1971 – January 3, 1973 |
92nd | Elected in 1970. Redistricted to the 23rd district. | |
 Hamilton Fish IV |
Republican | January 3, 1973 – January 3, 1983 |
93rd 94th 95th 96th 97th |
Redistricted from the 28th district and re-elected in 1972. Re-elected in 1974. Re-elected in 1976. Re-elected in 1978. Re-elected in 1980. Redistricted to the 21st district. |
1973–1983 [data unknown/missing] |
 Sherwood Boehlert |
Republican | January 3, 1983 – January 3, 1993 |
98th 99th 100th 101st 102nd |
Elected in 1982. Re-elected in 1984. Re-elected in 1986. Re-elected in 1988. Re-elected in 1990. Redistricted to the 23rd district. |
1983–1993 [data unknown/missing] |
 James T. Walsh |
Republican | January 3, 1993 – January 3, 2009 |
103rd 104th 105th 106th 107th 108th 109th 110th |
Redistricted from the 27th district and re-elected in 1992. Re-elected in 1994. Re-elected in 1996. Re-elected in 1998. Re-elected in 2000. Re-elected in 2002. Re-elected in 2004. Re-elected in 2006. Retired. |
1993–2003 [data unknown/missing] |
| 2003–2013 [data unknown/missing] | |||||
 Dan Maffei |
Democratic | January 3, 2009 – January 3, 2011 |
111th | Elected in 2008. Lost re-election. | |
 Ann Marie Buerkle |
Republican | January 3, 2011 – January 3, 2013 |
112th | Elected in 2010. Redistricted to the 24th district and lost re-election there. | |
 Louise Slaughter |
Democratic | January 3, 2013 – March 16, 2018 |
113th 114th 115th |
Redistricted from the 28th district and re-elected in 2012. Re-elected in 2014. Re-elected in 2016. Died. |
2013–present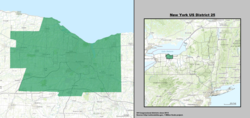 |
| Vacant | March 16, 2018 – November 13, 2018 |
115th | |||
 Joe Morelle |
Democratic | November 13, 2018 – Present |
115th 116th 117th |
Elected to finish Slaughter's term. Re-elected in 2018. Re-elected in 2020. Re-elected in 2022. | |
Election results
In New York State electoral politics, the state allows Electoral fusion, with numerous minor parties at various points on the political spectrum that typically endorse either the Republican or Democratic candidate for an office. Hence the state electoral results contain both the party votes, and the final candidate votes (Listed as "Recap").
| Party | Candidate | Votes | % | ±% | |
|---|---|---|---|---|---|
| Republican | James T. Walsh (incumbent) | 126,691 | 55.1 | ||
| Democratic | Marty Mack | 103,199 | 44.9 | ||
| Majority | 23,492 | 10.2 | |||
| Turnout | 229,890 | 100 | |||
| Party | Candidate | Votes | % | ±% | |
|---|---|---|---|---|---|
| Republican | James T. Walsh (incumbent) | 121,204 | 69.4 | +14.3 | |
| Democratic | Yvonne Rothenberg | 53,461 | 30.6 | -14.3 | |
| Majority | 67,743 | 38.8 | +28.6 | ||
| Turnout | 174,665 | 100 | -24.0 | ||
| Party | Candidate | Votes | % | ±% | |
|---|---|---|---|---|---|
| Republican | James T. Walsh (incumbent) | 151,880 | 69.0 | -0.4 | |
| Democratic | Francis J. Gavin | 64,533 | 29.3 | -1.3 | |
| Green | Howie Hawkins | 3,830 | 1.7 | +1.7 | |
| Majority | 87,347 | 39.7 | +0.9 | ||
| Turnout | 220,243 | 100 | +26.1 | ||
| Party | Candidate | Votes | % | ±% | |
|---|---|---|---|---|---|
| Republican | James T. Walsh (incumbent) | 144,610 | 72.3 | +3.3 | |
| Democratic | Stephanie Aldersley | 53,290 | 26.6 | -2.7 | |
| Working Families | Francis J. Gavin | 2,131 | 1.1 | +1.1 | |
| Majority | 91,320 | 45.7 | +6.0 | ||
| Turnout | 200,031 | 100 | -9.2 | ||
| Party | Candidate | Votes | % | ±% | |
|---|---|---|---|---|---|
| Republican | James T. Walsh (incumbent) | 189,063 | 90.4 | +18.1 | |
| Peace and Justice | Howie Hawkins | 20,106 | 9.6 | +9.6 | |
| Majority | 168,957 | 80.8 | +35.1 | ||
| Turnout | 209,169 | 100 | +4.6 | ||
| Party | Candidate | Votes | % | ±% | |
|---|---|---|---|---|---|
| Republican | James T. Walsh (incumbent) | 110,525 | 50.8 | -39.6 | |
| Democratic | Dan Maffei | 107,108 | 49.2 | +49.2 | |
| Majority | 3,417 | 1.6 | -79.2 | ||
| Turnout | 217,633 | 100 | +4.0 | ||
| Party | Candidate | Votes | % | ±% | |
|---|---|---|---|---|---|
| Democratic | Dan Maffei | 157,375 | 54.8 | +5.6 | |
| Republican | Dale Sweetland | 120,217 | 41.9 | -8.9 | |
| Green | Howie Hawkins | 9,483 | 3.3 | +3.3 | |
| Majority | 37,158 | 12.9 | +11.3 | ||
| Turnout | 287,075 | 100 | +31.9 | ||
| Party | Candidate | Votes | % | ±% | |
|---|---|---|---|---|---|
| Republican | Ann Marie Buerkle | 104,374 | 50.1 | +8.2 | |
| Democratic | Dan Maffei (incumbent) | 103,807 | 49.9 | -4.9 | |
| Turnout | 208,181 | 100 | -27.5 | ||
| Party | Candidate | Votes | % | ±% | |
|---|---|---|---|---|---|
| Democratic | Louise Slaughter | 168,761 | |||
| Working Families | Louise Slaughter | 11,049 | |||
| Total | Louise Slaughter (incumbent) | 179,810 | 57.4 | ||
| Republican | Maggie Brooks | 109,292 | |||
| Conservative | Maggie Brooks | 18,543 | |||
| Independence | Maggie Brooks | 5,554 | |||
| Total | Maggie Brooks | 133,389 | 42.6 | ||
| None | Blank/Void/Scattered | 9,561 | 0 | ||
| Total votes | 313,199 | 100.00 | |||
| Democratic hold | |||||
| Party | Candidate | Votes | % | ±% | |
|---|---|---|---|---|---|
| Democratic | Louise M. Slaughter | 87,264 | 44.41 | ||
| Working Families | Louise M. Slaughter | 9,539 | 4.85 | ||
| Total | Louise M. Slaughter (Incumbent) | 96,803 | 49.26 | ||
| Republican | Mark W. Assini | 75,990 | 38.67 | ||
| Conservative | Mark W. Assini | 19,942 | 10.15 | ||
| Total | Mark W. Assini | 95,932 | 48.82 | ||
| None | Blank/Void/Write-In | 3,781 | 1.92 | ||
| Total votes | 196,516 | 100 | |||
| Party | Candidate | Votes | % | ±% | |
|---|---|---|---|---|---|
| Democratic | Louise Slaughter | 168,660 | 50.14% | ||
| Working Families | Louise Slaughter | 10,195 | 3.03% | ||
| Women's Equality | Louise Slaughter | 4,095 | 1.22% | ||
| Total | Louise Slaughter (incumbent) | 182,950 | 54.39% | ||
| Republican | Mark Assini | 113,840 | 33.84% | ||
| Conservative | Mark Assini | 20,883 | 6.21% | ||
| Independence | Mark Assini | 6,856 | 2.04% | ||
| Reform | Mark Assini | 1,071 | 0.32% | ||
| Total | Mark Assini | 142,650 | 42.41% | ||
| None | Blank/Void/Scattering | 10,786 | 3.21% | ||
| Total votes | 336,386 | 100.00% | |||
| Democratic hold | |||||
| Party | Candidate | Votes | % | |
|---|---|---|---|---|
| Democratic | Joseph Morelle | 147,979 | 54.8 | |
| Working Families | Joseph Morelle | 4,575 | 1.7 | |
| Independence | Joseph Morelle | 4,585 | 1.7 | |
| Women's Equality | Joseph Morelle | 2,105 | 0.8 | |
| Total | Joseph Morelle | 149,993 | 59.0 | |
| Republican | Jim Maxwell | 91,342 | 33.8 | |
| Conservative | Jim Maxwell | 17,781 | 6.6 | |
| Reform | Jim Maxwell | 1,613 | 0.6 | |
| Total | Jim Maxwell | 105,925 | 41.0 | |
| Total votes | 269,980 | 100.0 | ||
| Democratic hold | ||||
| Party | Candidate | Votes | % | |
|---|---|---|---|---|
| Democratic | Joseph Morelle | 187,503 | 53.9 | |
| Working Families | Joseph Morelle | 14,584 | 4.2 | |
| Independence | Joseph Morelle | 4,309 | 1.2 | |
| Total | Joseph Morelle (incumbent) | 206,396 | 59.3 | |
| Republican | George Mitris | 115,940 | 33.4 | |
| Conservative | George Mitris | 20,258 | 5.8 | |
| Total | George Mitris | 136,198 | 39.2 | |
| Libertarian | Kevin Wilson | 5,325 | 1.5 | |
| Total votes | 347,919 | 100.0 | ||
| Democratic hold | ||||
Historical district boundaries

See also
- List of United States congressional districts
- New York's congressional districts
- United States congressional delegations from New York
References
- "My Congressional District".
- "Partisan Voting Index – Districts of the 115th Congress" (PDF). The Cook Political Report. April 7, 2017. Retrieved April 7, 2017.
- Joseph Morelle bio https://ballotpedia.org/Joseph_Morelle
- James Maxwell bio https://ballotpedia.org/James_Maxwell_(New_York)
- "New York's 25th Congressional District election, 2018". ballotpedia.org. Ballotpedia. Retrieved January 24, 2020.
- "November 3, 2020 General Election Certification" (PDF). New York State Board of Elections. September 17, 2020. Retrieved September 25, 2020.
- "2020 Election Results". New York State Board of Elections. Retrieved December 3, 2020.
- Martis, Kenneth C. (1989). The Historical Atlas of Political Parties in the United States Congress. New York: Macmillan Publishing Company.
- Martis, Kenneth C. (1982). The Historical Atlas of United States Congressional Districts. New York: Macmillan Publishing Company.
- Congressional Biographical Directory of the United States 1774–present
- 2004 House election data Clerk of the House of Representatives
- 2002 House election data "
- 2000 House election data "
- 1998 House election data "
- 1996 House election data "
Другой контент может иметь иную лицензию. Перед использованием материалов сайта WikiSort.org внимательно изучите правила лицензирования конкретных элементов наполнения сайта.
WikiSort.org - проект по пересортировке и дополнению контента Википедии