world.wikisort.org - USA
Iowa's 2nd congressional district is a congressional district in the U.S. state of Iowa that covers most of its southeastern part. It includes Davenport, Iowa City, Muscatine, Clinton, Burlington, Ottumwa, Fort Madison, Oskaloosa, Bettendorf, Newton and Pella. The bulk of its vote is cast in Iowa City and the Iowa side of the Quad Cities.
| Iowa's 2nd congressional district | |||
|---|---|---|---|


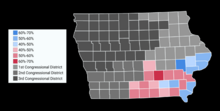
Interactive map of Iowa's 1st (green) and 2nd (blue) congressional district boundaries. In the 2020 United States redistricting cycle, the 2nd district is moved from the southeast quadrant of Iowa to the northeast quadrant. | |||
| Representative |
| ||
| Distribution |
| ||
| Population (2021) | 785,047 | ||
| Median household income | $62,612[1] | ||
| Ethnicity |
| ||
| Cook PVI | R+4[2] | ||
The district has been represented by Republican Mariannette Miller-Meeks since 2021.
Statewide races since 2000
Election results from statewide races:
| Office | Year | District | Statewide | Nationwide |
|---|---|---|---|---|
| President | 2000 | Al Gore 53% – George W. Bush 43% | Gore | Bush |
| 2004 | John Kerry 55% – George W. Bush 44% | Bush | ||
| 2008 | Barack Obama 60% – John McCain 38% | Obama | Obama | |
| 2012 | Barack Obama 56% – Mitt Romney 43% | |||
| 2016 | Donald Trump 49% – Hillary Clinton 44% | Trump | Trump | |
| 2020 | Donald Trump 51% – Joe Biden 47% | Biden | ||
| U.S. Senator | 2014 | Joni Ernst 49% – Bruce Braley 47% | Ernst | n/a |
| 2020 | Joni Ernst 49.2% – Theresa Greenfield 47.7% | Ernst | ||
| Governor | 2014 | Terry Branstad 57% – Jack Hatch 40% | Branstad | |
| 2018 | Fred Hubbell 50.7% – Kim Reynolds 47.3% | Reynolds |
List of members representing the district
| Member | Party | Term | Cong ress |
Electoral history | Location |
|---|---|---|---|---|---|
| District created March 4, 1847. | |||||
 Shepherd Leffler |
Democratic | March 4, 1847 – March 3, 1851 |
30th 31st |
Redistricted from the at-large district and re-elected in 1846. Re-elected in 1848. Retired. |
1847–1849 [data unknown/missing] |
| 1849–1859 [data unknown/missing] | |||||
 Lincoln Clark |
Democratic | March 4, 1851 – March 3, 1853 |
32nd | Elected in 1850. Lost re-election. | |
 John P. Cook |
Whig | March 4, 1853 – March 3, 1855 |
33rd | Elected in 1852. Retired. | |
 James Thorington |
Whig | March 4, 1855 – March 3, 1857 |
34th | Elected in 1854. Lost renomination. | |
 Timothy Davis |
Republican | March 4, 1857 – March 3, 1859 |
35th | Elected in 1856. Retired. | |
 William Vandever |
Republican | March 4, 1859 – March 3, 1863 |
36th 37th |
Elected in 1858. Re-elected in 1860. Retired.[lower-alpha 1] |
1859–1863 [data unknown/missing] |
 Hiram Price |
Republican | March 4, 1863 – March 3, 1869 |
38th 39th 40th |
Elected in 1862. Re-elected in 1864. Re-elected in 1866. Retired. |
1863–1873 [data unknown/missing] |
 William Smyth |
Republican | March 4, 1869 – September 30, 1870 |
41st | Elected in 1868. Died. | |
| Vacant | September 30, 1870 – December 6, 1870 |
||||
 William P. Wolf |
Republican | December 6, 1870 – March 3, 1871 |
Elected to finish Smyth's term. Retired. | ||
 Aylett R. Cotton |
Republican | March 4, 1871 – March 3, 1875 |
42nd 43rd |
Elected in 1870. Re-elected in 1872. Lost renomination.[lower-alpha 2] | |
| 1873–1883 [data unknown/missing] | |||||
 John Q. Tufts |
Republican | March 4, 1875 – March 3, 1877 |
44th | Elected in 1874. Retired. | |
Hiram Price |
Republican | March 4, 1877 – March 3, 1881 |
45th 46th |
Elected in 1876. Re-elected in 1878. Retired. | |
 Sewall S. Farwell |
Republican | March 4, 1881 – March 3, 1883 |
47th | Elected in 1880. Lost re-election. | |
 Jeremiah H. Murphy |
Democratic | March 4, 1883 – March 3, 1887 |
48th 49th |
Elected in 1882. Re-elected in 1884. Lost renomination. |
1883–1887 [data unknown/missing] |
 Walter I. Hayes |
Democratic | March 4, 1887 – March 3, 1895 |
50th 51st 52nd 53rd |
Elected in 1886. Re-elected in 1888. Re-elected in 1890. Re-elected in 1892. Lost re-election. |
1887–1933 [data unknown/missing] |
 George M. Curtis |
Republican | March 4, 1895 – March 3, 1899 |
54th 55th |
Elected in 1894. Re-elected in 1896. Retired. | |
 Joseph R. Lane |
Republican | March 4, 1899 – March 3, 1901 |
56th | Elected in 1898. Retired. | |
 John N. W. Rumple |
Republican | March 4, 1901 – January 31, 1903 |
57th | Elected in 1900. Retired and died before next term. | |
| Vacant | January 31, 1903 – March 3, 1903 |
||||
 Martin J. Wade |
Democratic | March 4, 1903 – March 3, 1905 |
58th | Elected in 1902. Lost re-election. | |
 Albert F. Dawson |
Republican | March 4, 1905 – March 3, 1911 |
59th 60th 61st |
Elected in 1904. Re-elected in 1906. Re-elected in 1908. Retired. | |
 Irvin S. Pepper |
Democratic | March 4, 1911 – December 22, 1913 |
62nd 63rd |
Elected in 1910. Re-elected in 1912. Died. | |
| Vacant | December 22, 1913 – February 10, 1914 |
63rd | |||
 Henry Vollmer |
Democratic | February 10, 1914 – March 3, 1915 |
Elected to finish Pepper's term. Retired. | ||
 Harry E. Hull |
Republican | March 4, 1915 – March 3, 1925 |
64th 65th 66th 67th 68th |
Elected in 1914. Re-elected in 1916. Re-elected in 1918. Re-elected in 1920. Re-elected in 1922. Lost renomination. | |
 F. Dickinson Letts |
Republican | March 4, 1925 – March 3, 1931 |
69th 70th 71st |
Elected in 1924. Re-elected in 1926. Re-elected in 1928. Lost re-election. | |
 Bernhard M. Jacobsen |
Democratic | March 4, 1931 – June 30, 1936 |
72nd 73rd 74th |
Elected in 1930. Re-elected in 1932. Re-elected in 1934. Died. | |
| 1933–1943 [data unknown/missing] | |||||
| Vacant | June 30, 1936 – January 3, 1937 |
74th | |||
 William S. Jacobsen |
Democratic | January 3, 1937 – January 3, 1943 |
75th 76th 77th |
Elected in 1936. Re-elected in 1938. Re-elected in 1940. Lost re-election. | |
 Henry O. Talle |
Republican | January 3, 1943 – January 3, 1959 |
78th 79th 80th 81st 82nd 83rd 84th 85th |
Redistricted from the 4th district and re-elected in 1942. Re-elected in 1944. Re-elected in 1946. Re-elected in 1948. Re-elected in 1950. Re-elected in 1952. Re-elected in 1954. Re-elected in 1956. Lost re-election. |
1943–1963 [data unknown/missing] |
 Leonard G. Wolf |
Democratic | January 3, 1959 – January 3, 1961 |
86th | Elected in 1958. Lost re-election. | |
 James E. Bromwell |
Republican | January 3, 1961 – January 3, 1965 |
87th 88th |
Elected in 1960. Re-elected in 1962. Lost re-election. | |
| 1963–1973 [data unknown/missing] | |||||
 John Culver |
Democratic | January 3, 1965 – January 3, 1975 |
89th 90th 91st 92nd 93rd |
Elected in 1964. Re-elected in 1966. Re-elected in 1968. Re-elected in 1970. Re-elected in 1972. Retired to run for U.S. senator. | |
| 1973–1983 [data unknown/missing] | |||||
 Mike Blouin |
Democratic | January 3, 1975 – January 3, 1979 |
94th 95th |
Elected in 1974. Re-elected in 1976. Lost re-election. | |
 Tom Tauke |
Republican | January 3, 1979 – January 3, 1991 |
96th 97th 98th 99th 100th 101st |
Elected in 1978. Re-elected in 1980. Re-elected in 1982. Re-elected in 1984. Re-elected in 1986. Re-elected in 1988. Retired to run for U.S. senator. | |
| 1983–1993 [data unknown/missing] | |||||
 Jim Nussle |
Republican | January 3, 1991 – January 3, 2003 |
102nd 103rd 104th 105th 106th 107th |
Elected in 1990. Re-elected in 1992. Re-elected in 1994. Re-elected in 1996. Re-elected in 1998. Re-elected in 2000. Redistricted to the 1st district. | |
| 1993–2003 [data unknown/missing] | |||||
 Jim Leach |
Republican | January 3, 2003 – January 3, 2007 |
108th 109th |
Redistricted from the 1st district and re-elected in 2002. Re-elected in 2004. Lost re-election. |
2003–2013 |
 Dave Loebsack |
Democratic | January 3, 2007 – January 3, 2021 |
110th 111th 112th 113th 114th 115th 116th |
Elected in 2006. Re-elected in 2008. Re-elected in 2010. Re-elected in 2012. Re-elected in 2014. Re-elected in 2016. Re-elected in 2018. Retired. | |
2013–present | |||||
 Mariannette Miller-Meeks |
Republican | January 3, 2021 – Present |
117th | Elected in 2020. Redistricted to the 1st district. | |
 Ashley Hinson |
Republican | January 3, 2023 – |
Redistricted from the 1st district and re-elected in 2022. | 2023–present: northeast quadrant of the state | |
- Service effectively ended in 1861 when promoted to Major General, but did not officially resign.
- Although his official Congressional biography states he declined to run for a third term, newspaper reports indicate that he was an active but unsuccessful candidate for renomination.
Recent election results
| Year | Winner | Loser | Percentage | ||||
|---|---|---|---|---|---|---|---|
| Party affiliation | Candidate | Votes | Party affiliation | Candidate | Votes | ||
| 1920 | Republican | Harry E. Hull | 50,160 | Farmer–Labor | F. B. Althouse | 6,058 | 89% – 11% |
| 1922 | 27,450 | Democratic | Wayne G. Cook | 25,620 | 51% – 48% | ||
| 1924 | Fred Dickinson Letts | 49,117 | Ralph U. Thompson | 32,893 | 60% – 40% | ||
| 1926 | 29,200 | J. P. Gallagher | 19,612 | 60% – 40% | |||
| 1928 | 49,690 | Frank Z. Titzell | 37,344 | 57% – 43% | |||
| 1930 | Democratic | Bernhard M. Jacobsen | 30,008 | Republican | F. D. Letts | 24,113 | 55% – 45% |
| 1932 | 71,914 | Frank W. Elliott | 50,636 | 59% – 41% | |||
| 1934 | 60,654 | Martin B. Andelfinger | 39,047 | 63% – 35% | |||
| 1936 | William S. Jacobsen | 70,923 | Charles Penningroth | 55,255 | 53% – 41% | ||
| 1938 | 48,155 | Alfred C. Mueller | 47,535 | 50% – 49% | |||
| 1940 | 75,774 | W. A. McCullough | 69,298 | 52% – 48% | |||
| 1942 | Republican | Henry O. Talle | 62,290 | Democratic | William S. Jacobsen | 46,310 | 57% – 43% |
| 1944 | 86,903 | George C. Classen | 68,489 | 56% – 44% | |||
| 1946 | 60,111 | Richard V. Bernhart | 41,544 | 59% – 41% | |||
| 1948 | 82,139 | T. W. Mullaney | 60,272 | 57% – 42% | |||
| 1950 | 79,066 | Eugene J. Kean | 55,359 | 59% – 41% | |||
| 1952 | 114,553 | T. W. Mullaney | 69,421 | 62% – 38% | |||
| 1954 | 72,231 | Ruben V. Austin | 58,092 | 55% – 46% | |||
| 1956 | 95,999 | Leonard G. Wolf | 90,843 | 51% – 49% | |||
| 1958 | Democratic | Leonard G. Wolf | 67,022 | Republican | Henry O. Talle | 64,073 | 51% – 49% |
| 1960 | Republican | James E. Bromwell | 108,137 | Democratic | Leonard G. Wolf | 97,608 | 53% – 47% |
| 1962 | 67,475 | Frank W. Less | 60,296 | 53% – 47% | |||
| 1964 | Democratic | John C. Culver | 97,470 | Republican | James E. Bromwell | 89,299 | 52% – 48% |
| 1966 | 76,281 | Robert M. L. Johnson | 65,079 | 54% – 46% | |||
| 1968 | 103,651 | Tom Riley | 84,634 | 55% – 45% | |||
| 1970 | 84,049 | Cole McMartin | 54,934 | 60% – 40% | |||
| 1972 | 115,489 | Theodore R. Ellsworth | 79,667 | 59% – 41% | |||
| 1974 | Michael T. Blouin | 73,416 | Tom Riley | 69,088 | 51% – 48% | ||
| 1976 | 102,980 | 100,344 | 50% – 49% | ||||
| 1978 | Republican | Thomas J. Tauke | 72,644 | Democratic | Michael T. Blouin | 65,450 | 52% – 47% |
| 1980 | 111,587 | Steve Sovern | 93,175 | 54% – 45% | |||
| 1982 | 99,478 | Brent Appel | 69,539 | 59% – 41% | |||
| 1984 | 136,839 | Joe Welsh | 77,335 | 64% – 36% | |||
| 1986 | 88,708 | Eric Tabor | 55,903 | 61% – 39% | |||
| 1988 | 113,543 | 86,438 | 58% – 43% | ||||
| 1990 | Jim Nussle | 82,650 | 81,008 | 50% – 49% | |||
| 1992 | 134,536 | David R. Nagle | 131,570 | 50% – 49% | |||
| 1994 | 111,076 | 86,087 | 56% – 43% | ||||
| 1996 | 127,827 | Donna L. Smith | 109,731 | 53% – 46% | |||
| 1998 | 104,613 | Rob Tully | 83,405 | 55% – 44% | |||
| 2000 | 139,906 | Donna L. Smith | 110,327 | 55% – 44% | |||
| 2002 | Jim Leach | 108,130 | Julie Thomas | 94,767 | 52% – 46% | ||
| 2004 | 176,684 | Dave Franker | 117,405 | 59% – 39% | |||
| 2006 | Democratic | Dave Loebsack | 107,097 | Republican | Jim Leach | 101,386 | 51% – 49% |
| 2008 | 173,639 | Mariannette Miller-Meeks | 118,040 | 57% – 38% | |||
| 2010 | 115,839 | 104,319 | 50% – 45% | ||||
| 2012 | 211,863 | John Archer | 161,977 | 55% – 42% | |||
| 2014 | 143,431 | Mariannette Miller-Meeks | 129,455 | 52% – 47% | |||
| 2016 | 198,571 | Christopher Peters | 170,933 | 53% – 46% | |||
| 2018 | 171,120 | 133,051 | 54% – 42% | ||||
| 2020 | Republican | Mariannette Miller-Meeks | 196,864 | Democratic | Rita Hart | 196,858 | 49.910% – 49.908% |
- "Election Statistics". 2005. Archived from the original on July 25, 2007.
2002
| Party | Candidate | Votes | % | |
|---|---|---|---|---|
| Republican | Jim Leach | 108,130 | 52.19% | |
| Democratic | Julie Thomas | 94,767 | 45.74% | |
| Libertarian | Kevin Litten | 4,178 | 2.02% | |
| No party | Others | 96 | 0.05% | |
| Total votes | 207,171 | 100.00% | ||
| Republican hold | ||||
2004
| Party | Candidate | Votes | % | |
|---|---|---|---|---|
| Republican | Jim Leach (incumbent) | 176,684 | 58.92% | |
| Democratic | Dave Franker | 117,405 | 39.15% | |
| Libertarian | Kevin Litten | 5,586 | 1.86% | |
| No party | Others | 206 | 0.07% | |
| Total votes | 299,881 | 100.00% | ||
| Republican hold | ||||
2006
| Party | Candidate | Votes | % | |||
|---|---|---|---|---|---|---|
| Democratic | Dave Loebsack | 107,683 | 51.38% | |||
| Republican | Jim Leach (incumbent) | 101,707 | 48.53% | |||
| No party | Others | 196 | 0.09% | |||
| Total votes | 209,586 | 100.00% | ||||
| Democratic gain from Republican | ||||||
2008
| Party | Candidate | Votes | % | |
|---|---|---|---|---|
| Democratic | Dave Loebsack (incumbent) | 175,218 | 57.19% | |
| Republican | Mariannette Miller-Meeks | 118,778 | 38.77% | |
| Green | Wendy Barth | 6,664 | 2.18% | |
| Independent | Brian White | 5,437 | 1.78% | |
| No party | Others | 261 | 0.09% | |
| Total votes | 306,358 | 100.00% | ||
| Democratic hold | ||||
2010
| Party | Candidate | Votes | % | |
|---|---|---|---|---|
| Democratic | Dave Loebsack (incumbent) | 115,839 | 50.99% | |
| Republican | Mariannette Miller-Meeks | 104,319 | 45.92% | |
| Libertarian | Gary Joseph Sicard | 4,356 | 1.92% | |
| Constitution | Jon Tack | 2,463 | 1.08% | |
| No party | Others | 198 | 0.09% | |
| Total votes | 227,175 | 100.00% | ||
| Democratic hold | ||||
2012
| Party | Candidate | Votes | % | |
|---|---|---|---|---|
| Democratic | Dave Loebsack (incumbent) | 211,863 | 55.57% | |
| Republican | John Archer | 161,977 | 42.48% | |
| Independent | Alan Aversa | 7,112 | 1.87% | |
| No party | Others | 323 | 0.08% | |
| Total votes | 381,275 | 100.00% | ||
| Democratic hold | ||||
2014
| Party | Candidate | Votes | % | |
|---|---|---|---|---|
| Democratic | Dave Loebsack (incumbent) | 143,431 | 52.5% | |
| Republican | Mariannette Miller-Meeks | 129,455 | 47.4% | |
| Write-ins | 443 | 0.2% | ||
| Total votes | 273,329 | 100% | ||
| Democratic hold | ||||
2016
| Party | Candidate | Votes | % | |
|---|---|---|---|---|
| Democratic | Dave Loebsack (incumbent) | 198,571 | 53.7% | |
| Republican | Christopher Peters | 170,933 | 46.2% | |
| Write-ins | 528 | 0.1% | ||
| Total votes | 370,032 | 100.00% | ||
| Democratic hold | ||||
2018

| Party | Candidate | Votes | % | ±% | |
|---|---|---|---|---|---|
| Democratic | Dave Loebsack (incumbent) | 171,120 | 54.8% | +1.1 | |
| Republican | Christopher Peters | 133,051 | 42.6% | −3.6 | |
| Libertarian | Mark David Strauss | 6,176 | 1.98% | +1.98 | |
| Independent | Daniel Clark | 1,839 | 0.59% | +0.59 | |
| Write-ins | 171 | 0.05% | −0.05 | ||
| Majority | 38,069 | 12.2% | |||
| Turnout | 312,357 | 100% | |||
| Democratic hold | Swing | +4.7 | |||
2020

| Party | Candidate | Votes | % | |
|---|---|---|---|---|
| Republican | Mariannette Miller-Meeks | 196,864 | 49.912% | |
| Democratic | Rita Hart | 196,858 | 49.910% | |
| Total votes | 394,439 | 100.0 | ||
| Republican gain from Democratic | ||||
Rita Hart announced on March 31, 2021, that she was dropping her challenge before the House Administration Committee but maintained that her attempt to contest — which she lost by six votes —was valid.[4]
Historical district boundaries

See also
- Iowa's congressional districts
- List of United States congressional districts
References
- Center for New Media & Promotion (CNMP), US Census Bureau. "My Congressional District". www.census.gov.
- "Introducing the 2021 Cook Political Report Partisan Voter Index". The Cook Political Report. April 15, 2021. Retrieved April 15, 2021.
- "Iowa General Election 2018". Iowa Secretary of State. Retrieved November 11, 2018.
- Conradis, Brandon (April 1, 2021). "Republicans take victory lap after Iowa Democrat drops challenge". TheHill. Retrieved April 2, 2021.
- Martis, Kenneth C. (1989). The Historical Atlas of Political Parties in the United States Congress. New York: Macmillan Publishing Company.
- Martis, Kenneth C. (1982). The Historical Atlas of United States Congressional Districts. New York: Macmillan Publishing Company.
- Congressional Biographical Directory of the United States 1774–present
| Authority control |
|
|---|
Текст в блоке "Читать" взят с сайта "Википедия" и доступен по лицензии Creative Commons Attribution-ShareAlike; в отдельных случаях могут действовать дополнительные условия.
Другой контент может иметь иную лицензию. Перед использованием материалов сайта WikiSort.org внимательно изучите правила лицензирования конкретных элементов наполнения сайта.
Другой контент может иметь иную лицензию. Перед использованием материалов сайта WikiSort.org внимательно изучите правила лицензирования конкретных элементов наполнения сайта.
2019-2026
WikiSort.org - проект по пересортировке и дополнению контента Википедии
WikiSort.org - проект по пересортировке и дополнению контента Википедии