world.wikisort.org - USA
Indiana's 1st congressional district is an electoral district for the U.S. Congress in Northwestern Indiana. The district is based in Gary and its surrounding suburbs and exurbs. It consists of all of Lake and Porter counties, as well as most of the western part La Porte County, on the border with Illinois and Michigan. Redistricting passed by the Indiana General Assembly in 2011 shifted the district's boundaries, effective January 2013, to include all of Lake and Porter counties and the western and northwestern townships of La Porte County, while moving Benton, Jasper and Newton counties out of the district.
| Indiana's 1st congressional district | |||
|---|---|---|---|
 Indiana's 1st congressional district since January 3, 2013 | |||
| Representative |
| ||
| Area | 2,209.37 sq mi (5,722.2 km2) | ||
| Distribution |
| ||
| Population (2021) | 735,140 | ||
| Median household income | $64,038[1] | ||
| Ethnicity |
| ||
| Cook PVI | D+3[2] | ||
The district is currently represented by Democrat Frank J. Mrvan. He was sworn in on January 3, 2021.
The district's character is very different from the rest of Indiana. It includes almost all of the Indiana side of the Chicago metropolitan area. While Porter and LaPorte are swing counties, Lake County is heavily Democratic. Lake County contains two-thirds of the district's population, which is enough to make the 1st a relatively safe Democratic seat. The district has not elected a Republican to Congress in 94 years, making it one of the longest continuously Democratic districts in the nation. Among Indiana's congressional districts, only the Indianapolis-based 7th District is more Democratic.
Election results from presidential races
| Year | Office | Result |
|---|---|---|
| 2000 | President | Al Gore 56 - George W. Bush 42% |
| 2004 | President | John Kerry 55 - George W. Bush 44% |
| 2008 | President | Barack Obama 63.3 - John McCain 35.8% |
| 2012 | President | Barack Obama 61.2 - Mitt Romney 37.4% |
| 2016 | President | Hillary Clinton 54.1 - Donald Trump 41.5% |
| 2020 | President | Joe Biden 53.6 - Donald Trump 44.8% |
List of members representing the district
| Representative | Party | Term | Cong ress |
Electoral history | Location |
|---|---|---|---|---|---|
| District created March 4, 1823 | |||||
| William Prince | Democratic- Republican |
March 4, 1823 – September 8, 1824 |
18th | Elected in 1822. Announced retirement then died. |
1823–1833 Daviess, Dubois, Gibson, Greene, Knox, Lawrence, Martin, Monroe, Morgan, Orange, Owen, Parke, Perry, Pike, Posey, Putnam, Spencer, Sullivan, Vanderburgh, Vigo, and Warrick Counties |
| Vacant | September 8, 1824 – December 23, 1824 | ||||
| Jacob Call | Democratic- Republican[lower-alpha 1] |
December 23, 1824 – March 3, 1825 |
Elected only to finish Prince's term, but not the next term. | ||
 Ratliff Boon |
Jacksonian | March 4, 1825 – March 3, 1827 |
19th | Elected in 1824. Lost re-election. | |
| Thomas H. Blake | Anti-Jacksonian | March 4, 1827 – March 3, 1829 |
20th | Elected in 1826. Lost re-election. | |
Ratliff Boon |
Jacksonian | March 4, 1829 – March 3, 1837 |
21st 22nd 23rd 24th 25th |
Elected in 1828. Re-elected in 1831. Re-elected in 1833. Re-elected in 1835. Re-elected in 1837. Retired. | |
| 1833–1843 [data unknown/missing] | |||||
| Democratic | March 4, 1837 – March 3, 1839 | ||||
| George H. Proffit | Whig | March 4, 1839 – March 3, 1843 |
26th 27th |
Elected in 1839. Re-elected in 1841. Retired. | |
 Robert D. Owen |
Democratic | March 4, 1843 – March 3, 1847 |
28th 29th |
Elected in 1843. Re-elected in 1845. Lost re-election. |
1843–1853 [data unknown/missing] |
 Elisha Embree |
Whig | March 4, 1847 – March 3, 1849 |
30th | Elected in 1847. Lost re-election. | |
| Nathaniel Albertson | Democratic | March 4, 1849 – March 3, 1851 |
31st | Elected in 1849. Lost renomination. | |
 James Lockhart |
Democratic | March 4, 1851 – March 3, 1853 |
32nd | Elected in 1851. Retired. | |
| Smith Miller | Democratic | March 4, 1853 – March 3, 1857 |
33rd 34th |
Elected in 1852. Re-elected in 1854. Retired. |
1853–1863 [data unknown/missing] |
James Lockhart |
Democratic | March 4, 1857 – September 7, 1857 |
35th | Elected in 1856. Died. | |
| Vacant | September 7, 1857 – December 7, 1857 | ||||
 William E. Niblack |
Democratic | December 7, 1857 – March 3, 1861 |
35th 36th |
Elected to finish Lockhart's term. Re-elected in 1858. Retired. | |
 John Law |
Democratic | March 4, 1861 – March 3, 1865 |
37th 38th |
Elected in 1860. Re-elected in 1862. Retired. | |
| 1863–1873 [data unknown/missing] | |||||
William E. Niblack |
Democratic | March 4, 1865 – March 3, 1875 |
39th 40th 41st 42nd 43rd |
Elected in 1864. Re-elected in 1866. Re-elected in 1868. Re-elected in 1870. Re-elected in 1872. Retired. | |
| 1873–1883 [data unknown/missing] | |||||
 Benoni S. Fuller |
Democratic | March 4, 1875 – March 3, 1879 |
44th 45th |
Elected in 1874. Re-elected in 1876. Retired. | |
 William Heilman |
Republican | March 4, 1879 – March 3, 1883 |
46th 47th |
Elected in 1878. Re-elected in 1880. Lost re-election. | |
| John J. Kleiner | Democratic | March 4, 1883 – March 3, 1887 |
48th 49th |
Elected in 1882. Re-elected in 1884. Lost renomination. |
1883–1893 [data unknown/missing] |
 Alvin P. Hovey |
Republican | March 4, 1887 – January 17, 1889 |
50th | Elected in 1886. Resigned when elected Governor of Indiana. | |
| Vacant | January 17, 1889 – January 29, 1889 | ||||
 Francis B. Posey |
Republican | January 29, 1889 – March 3, 1889 |
Elected to finish Hovey's term. Lost election to the next term. | ||
 William F. Parrett |
Democratic | March 4, 1889 – March 3, 1893 |
51st 52nd |
Elected in 1888. Re-elected in 1890. Retired. | |
 Arthur H. Taylor |
Democratic | March 4, 1893 – March 3, 1895 |
53rd | Elected in 1892. Lost re-election. |
1893–1903 [data unknown/missing] |
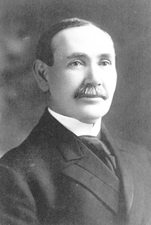 James A. Hemenway |
Republican | March 4, 1895 – March 3, 1905 |
54th 55th 56th 57th 58th |
Elected in 1894. Re-elected in 1896. Re-elected in 1898. Re-elected in 1900. Re-elected in 1902. Re-elected in 1904, but resigned when elected U.S. Senator. | |
| 1903–1913 [data unknown/missing] | |||||
| Vacant | March 4, 1905 – May 16, 1905 |
59th | |||
 John H. Foster |
Republican | May 16, 1905 – March 3, 1909 |
59th 60th |
Elected to finish the vacant term. Re-elected in 1906. Lost re-election. | |
 John W. Boehne |
Democratic | March 4, 1909 – March 3, 1913 |
61st 62nd |
Elected in 1908. Re-elected in 1910. Retired. | |
 Charles Lieb |
Democratic | March 4, 1913 – March 3, 1917 |
63rd 64th |
Elected in 1912. Re-elected in 1914. Retired. |
1913–1933 [data unknown/missing] |
 George K. Denton |
Democratic | March 4, 1917 – March 3, 1919 |
65th | Elected in 1916. Lost re-election. | |
 Oscar R. Luhring |
Republican | March 4, 1919 – March 3, 1923 |
66th 67th |
Elected in 1918. Re-elected in 1920. Lost re-election. | |
| William E. Wilson | Democratic | March 4, 1923 – March 3, 1925 |
68th | Elected in 1922. Lost re-election. | |
 Harry E. Rowbottom |
Republican | March 4, 1925 – March 3, 1931 |
69th 70th 71st |
Elected in 1924. Re-elected in 1926. Re-elected in 1928. Lost re-election. | |
| John W. Boehne Jr. | Democratic | March 4, 1931 – March 3, 1933 |
72nd | Elected in 1930. Redistricted to the 8th district. | |
 William T. Schulte |
Democratic | March 4, 1933 – January 3, 1943 |
73rd 74th 75th 76th 77th |
Elected in 1932. Re-elected in 1934. Re-elected in 1936. Re-elected in 1938. Re-elected in 1940. Lost renomination. |
1933–1933 [data unknown/missing] |
 Ray J. Madden |
Democratic | January 3, 1943 – January 3, 1977 |
78th 79th 80th 81st 82nd 83rd 84th 85th 86th 87th 88th 89th 90th 91st 92nd 93rd 94th |
Elected in 1942. Re-elected in 1944. Re-elected in 1946. Re-elected in 1948. Re-elected in 1950. Re-elected in 1952. Re-elected in 1954. Re-elected in 1956. Re-elected in 1958. Re-elected in 1960. Re-elected in 1962. Re-elected in 1964. Re-elected in 1966. Re-elected in 1968. Re-elected in 1970. Re-elected in 1972. Re-elected in 1974. Lost renomination. |
1943–1953 [data unknown/missing] |
| 1953–1963 [data unknown/missing] | |||||
| 1963–1973 [data unknown/missing] | |||||
| 1973–1983 [data unknown/missing] | |||||
 Adam Benjamin Jr. |
Democratic | January 3, 1977 – September 7, 1982 |
95th 96th 97th |
Elected in 1976. Re-elected in 1978. Re-elected in 1980. Died. | |
| Vacant | September 7, 1982 – November 2, 1982 |
97th | |||
 Katie B. Hall |
Democratic | November 2, 1982 – January 3, 1985 |
97th 98th |
Elected to finish Benjamin's term. Re-elected in 1982. Lost renomination. | |
| 1983–1993 [data unknown/missing] | |||||
 Pete Visclosky |
Democratic | January 3, 1985 – January 3, 2021 |
99th 100th 101st 102nd 103rd 104th 105th 106th 107th 108th 109th 110th 111th 112th 113th 114th 115th 116th |
Elected in 1984. Re-elected in 1986. Re-elected in 1988. Re-elected in 1990. Re-elected in 1992. Re-elected in 1994. Re-elected in 1996. Re-elected in 1998. Re-elected in 2000. Re-elected in 2002. Re-elected in 2004. Re-elected in 2006. Re-elected in 2008. Re-elected in 2010. Re-elected in 2012. Re-elected in 2014. Re-elected in 2016. Re-elected in 2018. Retired. | |
| 1993–2003 [data unknown/missing] | |||||
2003–2013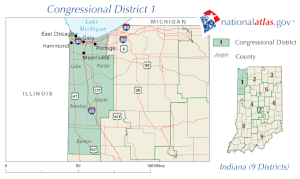 | |||||
| 2013–2023 | |||||
 Frank J. Mrvan |
Democratic | January 3, 2021 – present |
117th | Elected in 2020. Re-elected in 2022. | |
2023–present | |||||
Composition

| # | County | Seat | Population |
|---|---|---|---|
| 89 | Lake | Crown Point | 498,700 |
| 127 | Porter | Valparaiso | 173,215 |
- 91 LaPorte County exists in both the 1st and 2nd Congressional districts. One city, La Porte, exists in the 1st and 2nd congressional districts, and two cities, Michigan City and New Durham, exist in the 1st congressional district. Five townships, Clinton, Clinton, Dewey, New Durham, and Springfield exists in the 1st congressional district, and eleven townships, Hanna, Hudson, Johnson, Lincoln, Noble, Pleasant, Prairie, Scipio, Union, Washington, and Wills exist in the 2nd congressional district.
As of 2021, Indiana's 1st congressional district is composed of Lake (pop. 496,005) and Porter (pop. 164,343) counties as well as part of LaPorte County (pop. 111,467), which is also partly within Indiana's 2nd district. Michigan City and five townships (Clinton, Coolspring, Dewey, New Durham, and Springfield) exist entirely in the 1st district. La Porte and eleven townships (Hanna, Hudson, Johnson, Lincoln, Noble, Pleasant, Prairie, Scipio, Union, Washington, and Wills) are split between the 1st and 2nd districts by Indiana West 500N and Indiana South/North 600W.
Cities of 10,000 or more people
- Hammond - 80,830
- Gary - 80,294
- Portage - 36,828
- Valparaiso - 31,730
- Michigan City - 31,479
- Crown Point - 27,317
- East Chicago - 29,698
- Hobart - 29,059
- Lake Station - 12,572
Towns of 10,000 or more people
- Cedar Lake - 11,560
- Dyer - 16,390
- Griffith - 16,893
- Highland - 23,727
- Merrillville - 35,246
- Munster - 23,603
- Schererville - 29,243
- St. John-14,850
- Chesterton - 13,068
2,500 - 10,000 people
Election results
| Party | Candidate | Votes | % | |
|---|---|---|---|---|
| Democratic | Ratliff Boon | 4,281 | 42.1 | |
| Independent | Jacob Call | 3,222 | 31.7 | |
| Anti-Jacksonian | Thomas H. Blake | 2,661 | 26.2 | |
| Party | Candidate | Votes | % | |
|---|---|---|---|---|
| Anti-Jacksonian | Thomas H. Blake | 5,223 | 43.0 | |
| Democratic | Ratliff Boon | 5,202 | 42.8 | |
| Independent | Lawrence S. Shuler | 1,723 | 14.2 | |
| Party | Candidate | Votes | % | |
|---|---|---|---|---|
| Democratic | Ratliff Boon | 7,272 | 52.2 | |
| Anti-Jacksonian | Thomas H. Blake | 6,671 | 47.8 | |
| Party | Candidate | Votes | % | |
|---|---|---|---|---|
| Democratic | Ratliff Boon | 11,280 | 50.9 | |
| Democratic | John Law | 10,868 | 49.1 | |
| Party | Candidate | Votes | % | |
|---|---|---|---|---|
| Democratic | Ratliff Boon | 3,973 | 50.6 | |
| Independent | Dennis Pennington | 1,120 | 14.3 | |
| Independent | Robert M. Evans | 1,069 | 13.6 | |
| Independent | James R. E. Goodlet | 788 | 10.0 | |
| Independent | Seth M. Levenworth | 611 | 7.8 | |
| Party | Candidate | Votes | % | |
|---|---|---|---|---|
| Democratic | Ratliff Boon | 4,028 | 51.4 | |
| Whig | John G. Clendenin | 3,815 | 48.6 | |
| Party | Candidate | Votes | % | |
|---|---|---|---|---|
| Democratic | Ratliff Boon | 4,534 | 50.4 | |
| Whig | John Pitcher | 4,467 | 49.6 | |
| Party | Candidate | Votes | % | |
|---|---|---|---|---|
| Whig | George H. Proffit | 6,008 | 53.5 | |
| Democratic | Robert Dale Owen | 5,229 | 46.5 | |
| Party | Candidate | Votes | % | |
|---|---|---|---|---|
| Whig | Joseph Trumbull | 5,142 | 57.1 | |
| Democratic | Thomas Seymour | 3,867 | 42.9 | |
| Party | Candidate | Votes | % | |
|---|---|---|---|---|
| Democratic | Robert Dale Owen | 6,679 | 52.2 | |
| Whig | John W. Payne | 6,127 | 47.8 | |
| Party | Candidate | Votes | % | |
|---|---|---|---|---|
| Democratic | Robert Dale Owen | 7,336 | 53.7 | |
| Whig | George P. R. Wilson | 6,331 | 46.3 | |
| Party | Candidate | Votes | % | |
|---|---|---|---|---|
| Whig | Elisha Embree | 7,446 | 51.4 | |
| Democratic | Robert Dale Owen | 7,054 | 48.7 | |
| Party | Candidate | Votes | % | |
|---|---|---|---|---|
| Democratic | Nathaniel Albertson | 8,271 | 52.1 | |
| Whig | Elisha Embree | 7,598 | 47.9 | |
| Party | Candidate | Votes | % | |
|---|---|---|---|---|
| Democratic | James Lockhart | 8,173 | 51.0 | |
| Whig | Lemuel Debruler | 7,855 | 49.0 | |
| Party | Candidate | Votes | % | |
|---|---|---|---|---|
| Democratic | Smith Miller | 9,007 | 59.0 | |
| Whig | Kea | 9,007 | 51.0 | |
| Party | Candidate | Votes | % | |
|---|---|---|---|---|
| Democratic | Smith Miller | 9,864 | 52.2 | |
| Know-Nothing | Hall | 9,051 | 47.9 | |
| Party | Candidate | Votes | % | |
|---|---|---|---|---|
| Democratic | James Lockhart | 12,747 | 61.5 | |
| Republican | James C. Veatch | 7,977 | 38.5 | |
| Party | Candidate | Votes | % | |
|---|---|---|---|---|
| Democratic | William E. Niblack | 10,329 | ||
| Republican | Alvin P. Hovey | 8,946 | 46.4 | |
| Party | Candidate | Votes | % | |
|---|---|---|---|---|
| Democratic | John Law | 13,476 | 55.7 | |
| Republican | Lemuel Debruler | 10,731 | 44.3 | |
| Party | Candidate | Votes | % | |
|---|---|---|---|---|
| Democratic | John Law | 11,963 | 53.1 | |
| National Union | Johnson | 10,583 | 46.9 | |
| Party | Candidate | Votes | % | |
|---|---|---|---|---|
| Democratic | William E. Niblack | 14,718 | 53.9 | |
| National Union | Cyrus M. Allen | 112,616 | 46.2 | |
| Party | Candidate | Votes | % | |
|---|---|---|---|---|
| Democratic | William E. Niblack | 17,255 | 52.0 | |
| Republican | Lemuel Debruler | 15,905 | 48.0 | |
| Party | Candidate | Votes | % | |
|---|---|---|---|---|
| Democratic | William E. Niblack | 18,116 | 52.1 | |
| Republican | James Veatch | 16,631 | 47.9 | |
| Party | Candidate | Votes | % | |
|---|---|---|---|---|
| Democratic | William E. Niblack | 17,577 | 53.4 | |
| Republican | Hy C. Goodling | 15,327 | 46.6 | |
| Party | Candidate | Votes | % | |
|---|---|---|---|---|
| Democratic | William E. Niblack | 19,259 | 50.2 | |
| Republican | Heilman | 19,127 | 49.8 | |
| Party | Candidate | Votes | % | |
|---|---|---|---|---|
| Democratic | Benoni S. Fuller | 12,864 | 50.7 | |
| Republican | Heilman | 12,527 | 49.3 | |
| Party | Candidate | Votes | % | |
|---|---|---|---|---|
| Democratic | Benoni S. Fuller | 14,727 | 50.6 | |
| Republican | C. A. Debruler | 13,158 | 45.2 | |
| Party | Candidate | Votes | % | |
|---|---|---|---|---|
| Republican | William Heilman | 13,928 | 48.7 | |
| Democratic | Thomas E. Garvin | 13,928 | 48.7 | |
| Greenback | Thomas F. Drebruler | 1,595 | 5.6 | |
| Party | Candidate | Votes | % | |
|---|---|---|---|---|
| Republican | William Heilman | 17,719 | 49.4 | |
| Democratic | John Kleiner | 17,420 | 48.6 | |
| Party | Candidate | Votes | % | |
|---|---|---|---|---|
| Democratic | John Kleiner | 18,048 | 51.6 | |
| Republican | William Heilman | 16,399 | 46.9 | |
| Party | Candidate | Votes | % | |
|---|---|---|---|---|
| Democratic | John J. Kleiner | 19,930 | 51.5 | |
| Republican | William H. Gudgel | 18,493 | 47.8 | |
| Party | Candidate | Votes | % | |
|---|---|---|---|---|
| Republican | Alvin P. Hovey | 18,258 | 49.0 | |
| Democratic | J. E. McCullough | 16,901 | 45.4 | |
| Party | Candidate | Votes | % | |
|---|---|---|---|---|
| Democratic | William F. Parrett | 20,647 | 49.3 | |
| Republican | Frank B. Posey | 20,627 | 49.3 | |
| Party | Candidate | Votes | % | |
|---|---|---|---|---|
| Democratic | William F. Parrett | 17,730 | 50.4 | |
| Republican | James S. Wright | 16,875 | 48.0 | |
| Party | Candidate | Votes | % | |
|---|---|---|---|---|
| Democratic | Arthur H. Taylor | 19,720 | 47.4 | |
| Republican | A. P. Twineham | 19,266 | 46.3 | |
| Populist | Moses Smith | 2,110 | 5.1 | |
| Party | Candidate | Votes | % | |
|---|---|---|---|---|
| Republican | James A. Hemenway | 20,535 | 47.8 | |
| Democratic | Arthur H. Taylor | 18,245 | 42.5 | |
| Populist | James A. Boyce | 3,820 | 8.9 | |
| Party | Candidate | Votes | % | |
|---|---|---|---|---|
| Republican | James A. Hemenway | 21,807 | 49.6 | |
| Democratic | Thomas Duncan | 20,856 | 47.4 | |
| Party | Candidate | Votes | % | |
|---|---|---|---|---|
| Republican | James A. Hemenway | 20,383 | 50.7 | |
| Democratic | Thomas Duncan | 19,337 | 48.1 | |
| Party | Candidate | Votes | % | |
|---|---|---|---|---|
| Republican | James A. Hemenway | 22,262 | 49.7 | |
| Democratic | Alfred Dale Owen | 22,060 | 49.3 | |
| Party | Candidate | Votes | % | |
|---|---|---|---|---|
| Republican | James A. Hemenway | 21,542 | 52.0 | |
| Democratic | John W. Spencer | 17,833 | 43.1 | |
| Party | Candidate | Votes | % | |
|---|---|---|---|---|
| Republican | James A. Hemenway | 23,158 | 51.1 | |
| Democratic | Albert G. Holcomb | 19,399 | 42.8 | |
| Party | Candidate | Votes | % | |
|---|---|---|---|---|
| Republican | James H. Foster | 20c278 | 50.0 | |
| Democratic | Gusatvus V. Menzies | 18,959 | 46.7 | |
| Party | Candidate | Votes | % | |
|---|---|---|---|---|
| Democratic | John W. Boehne | 23,054 | 48.3 | |
| Republican | John H. Foster | 22,965 | 48.1 | |
| Party | Candidate | Votes | % | |
|---|---|---|---|---|
| Democratic | John W. Boehne | 22,420 | 52.3 | |
| Republican | Francis B. Posey | 18,606 | 43.4 | |
\
| Party | Candidate | Votes | % | |
|---|---|---|---|---|
| Democratic | Charles Lieb | 20,014 | 45.7 | |
| Republican | D.H. Ortmeyer | 13,158 | 30.0 | |
| Progressive | Humphrey C. Heidt | 6,022 | 13.7 | |
| Socialist | William H Rainey | 3,737 | 8.5 | |
| Party | Candidate | Votes | % | |
|---|---|---|---|---|
| Democratic | Charles Lieb | 20,488 | 46.6 | |
| Republican | S. Wallace Cook | 17,661 | 40.1 | |
| Progressive | U.H Seider | 3,519 | 8.0 | |
| Party | Candidate | Votes | % | |
|---|---|---|---|---|
| Democratic | George F. Denton | 23,278 | 48.1 | |
| Republican | S. Wallace Cook | 22,955 | 47.4 | |
| Party | Candidate | Votes | % | |
|---|---|---|---|---|
| Republican | Oscar R. Luhring | 20,440 | 52.0 | |
| Democratic | George K. Denton | 18,837 | 48.0 | |
| Party | Candidate | Votes | % | |
|---|---|---|---|---|
| Republican | Oscar R. Luhring | 44,694 | 51.7 | |
| Democratic | William E. Wilson | 36,834 | 42.6 | |
| Party | Candidate | Votes | % | |
|---|---|---|---|---|
| Democratic | William . Wilson | 42,797 | 53.6 | |
| Republican | Oscar . Luhring | 36,835 | 44.9 | |
| Party | Candidate | Votes | % | |
|---|---|---|---|---|
| Republican | Harry E. Rowbottom | 48,203 | 52.1 | |
| Democratic | William E. Wilson | 44,335 | 47.9 | |
| Party | Candidate | Votes | % | |
|---|---|---|---|---|
| Republican | Harry E. Rowbottom | 37,503 | 52.4 | |
| Democratic | William E. Wilson | 34,061 | 47.6 | |
| Party | Candidate | Votes | % | |
|---|---|---|---|---|
| Republican | Harry E. Rowbottom | 49,013 | 50.8 | |
| Democratic | John W. Boehne Jr. | 47,404 | 49.2 | |
| Party | Candidate | Votes | % | |
|---|---|---|---|---|
| Democratic | John W. Boehne Jr. | 46,836 | 53.9 | |
| Republican | Harry E. Rowbottom | 40,015 | 46.1 | |
| Party | Candidate | Votes | % | |
|---|---|---|---|---|
| Democratic | William T. Schulte | 45,473 | 50.0 | |
| Republican | Oscar A. Ahlgren | 42,575 | 46.8 | |
| Party | Candidate | Votes | % | |
|---|---|---|---|---|
| Democratic | William T. Schulte | 44,983 | 53.5 | |
| Republican | E. Miles Norton | 38,531 | 45.9 | |
| Party | Candidate | Votes | % | |
|---|---|---|---|---|
| Democratic | William T. Schulte | 68,210 | 66.4 | |
| Republican | Fred F. Schultx | 24,259 | 33.3 | |
| Party | Candidate | Votes | % | |
|---|---|---|---|---|
| Democratic | William T.Schulte | 56,630 | 54.9 | |
| Republican | M. Elliott Belshaw | 46,370 | 45.0 | |
| Party | Candidate | Votes | % | |
|---|---|---|---|---|
| Democratic | William T. Schulte | 71,606 | 60.8 | |
| Republican | Elliot Belshaw | 45,947 | 39.0 | |
| Party | Candidate | Votes | % | |
|---|---|---|---|---|
| Democratic | Ray J. Madden | 44,334 | 53.6 | |
| Republican | Samuel W. Cullison | 38,450 | 48.5 | |
| Party | Candidate | Votes | % | |
|---|---|---|---|---|
| Democratic | Ray J. Madden | 75,635 | 61.3 | |
| Republican | Otto G. Fifield | 46,969 | 38.1 | |
| Party | Candidate | Votes | % | |
|---|---|---|---|---|
| Democratic | Ray J. Madden | 51,809 | 51.9 | |
| Republican | Charles W. Gannon | 46,677 | 48.8 | |
| Party | Candidate | Votes | % | |
|---|---|---|---|---|
| Democratic | Ray J. Madden | 78,898 | 60.7 | |
| Republican | Theodore L. Sendak | 50,194 | 38.6 | |
| Party | Candidate | Votes | % | |
|---|---|---|---|---|
| Democratic | Ray J. Madden | 62,666 | 52.6 | |
| Republican | Paul Cyr | 56,063 | 47.0 | |
| Party | Candidate | Votes | % | |
|---|---|---|---|---|
| Democratic | Ray J. Madden | 93,187 | 56.4 | |
| Republican | Elliot Belshaw | 71,617 | 43.3 | |
| Party | Candidate | Votes | % | |
|---|---|---|---|---|
| Democratic | Ray J. Madden | 81,217 | 61.4 | |
| Republican | Robert H. More | 50,439 | 38.2 | |
| Party | Candidate | Votes | % | |
|---|---|---|---|---|
| Democratic | Ray J. Madden | 93,658 | 52.6 | |
| Republican | Donald K. Stimson Jr. | 84,125 | 47.2 | |
| Party | Candidate | Votes | % | |
|---|---|---|---|---|
| Democratic | Ray J. Madden | 95,801 | 66.4 | |
| Republican | Edward P. Keck | 47,588 | 33.0 | |
| Party | Candidate | Votes | % | |
|---|---|---|---|---|
| Democratic | Ray J. Madden | 136,443 | 64.7 | |
| Republican | Phillip P. Parker | 73,984 | 35.1 | |
| Party | Candidate | Votes | % | |
|---|---|---|---|---|
| Democratic | Ray J. Madden | 104,212 | 60.5 | |
| Republican | Harold Moody | 67,230 | 39.0 | |
| Party | Candidate | Votes | % | |
|---|---|---|---|---|
| Democratic | Ray J. Madden | 133,089 | 63.7 | |
| Republican | Arthur Endres | 75,226 | 36.0 | |
| Party | Candidate | Votes | % | |
|---|---|---|---|---|
| Democratic | Ray J. Madden | 71,040 | 58.3 | |
| Republican | Albert F. Harrigan | 50,804 | 41.7 | |
| Party | Candidate | Votes | % | |
|---|---|---|---|---|
| Democratic | Ray J. Madden | 90,055 | 56.7 | |
| Republican | Donalrd E. Taylor | 68,318 | 43.0 | |
| Party | Candidate | Votes | % | |
|---|---|---|---|---|
| Democratic | Ray J. Madden | 73,145 | 65.6 | |
| Republican | Eugene M. Kirtland | 38,294 | 34.4 | |
| Party | Candidate | Votes | % | |
|---|---|---|---|---|
| Democratic | Ray J. Madden | 95,873 | 56.9 | |
| Republican | Bruce R. Haller | 72,662 | 43.1 | |
| Party | Candidate | Votes | % | |
|---|---|---|---|---|
| Democratic | Ray J. Madden | 71,759 | 68.6 | |
| Republican | Joseph D. Harkin | 32,793 | 31.4 | |
| Party | Candidate | Votes | % | |
|---|---|---|---|---|
| Democratic | Adam Benjamin Jr. | 121,155 | 71.3 | |
| Republican | Robert J. Billings | 48,756 | 31.7 | |
| Party | Candidate | Votes | % | |
|---|---|---|---|---|
| Democratic | Adam Benjamin Jr. | 72,367 | 80.2% | |
| Republican | Robert J. Billings | 17,419 | 19.3 | |
| U.S. Labor | Christopher Martinson | 384 | 0.4% | |
| Party | Candidate | Votes | % | |
|---|---|---|---|---|
| Democratic | Adam Benjamin Jr. | 112,016 | 72.0% | |
| Republican | Joseph Douglas Harkin | 43,537 | 28.0% | |
2002
| Party | Candidate | Votes | % | |
|---|---|---|---|---|
| Democratic | Pete Visclosky (Incumbent) | 90,443 | 66.94% | |
| Republican | Mark J. Leyva | 41,909 | 31.02% | |
| Libertarian | Timothy P. Brennan | 2,759 | 2.04% | |
| Total votes | 135,111 | 100.00% | ||
| Turnout | ||||
| Democratic hold | ||||
2004
| Party | Candidate | Votes | % | |
|---|---|---|---|---|
| Democratic | Pete Visclosky (Incumbent) | 178,406 | 68.29% | |
| Republican | Mark J. Leyva | 82,858 | 31.71% | |
| Total votes | 261,264 | 100.00% | ||
| Turnout | ||||
| Democratic hold | ||||
2006
| Party | Candidate | Votes | % | |
|---|---|---|---|---|
| Democratic | Pete Visclosky (Incumbent) | 104,195 | 69.65% | |
| Republican | Mark J. Leyva | 40,146 | 26.83% | |
| Independent | Chuck Barman | 5,266 | 3.52% | |
| Total votes | 149,607 | 100.00% | ||
| Turnout | ||||
| Democratic hold | ||||
2008
| Party | Candidate | Votes | % | |
|---|---|---|---|---|
| Democratic | Pete Visclosky (Incumbent) | 199,954 | 70.90% | |
| Republican | Mark J. Leyva | 76,647 | 27.18% | |
| Libertarian | Jeff Duensing | 5,421 | 1.92% | |
| Total votes | 282,022 | 100.00% | ||
| Turnout | ||||
| Democratic hold | ||||
2010
| Party | Candidate | Votes | % | |
|---|---|---|---|---|
| Democratic | Pete Visclosky (Incumbent) | 99,387 | 58.56% | |
| Republican | Mark J. Leyva | 65,558 | 38.63% | |
| Libertarian | Jon Morris | 4,762 | 2.81% | |
| Total votes | 169,707 | 100.00% | ||
| Turnout | ||||
| Democratic hold | ||||
Recent elections
2012
| Party | Candidate | Votes | % | |
|---|---|---|---|---|
| Democratic | Pete Visclosky (Incumbent) | 187,743 | 67.28% | |
| Republican | Joel Phelps | 91,291 | 32.72% | |
| Total votes | 279,034 | 100.00% | ||
| Turnout | ||||
| Democratic hold | ||||
2014
| Party | Candidate | Votes | % | |
|---|---|---|---|---|
| Democratic | Pete Visclosky (Incumbent) | 86,579 | 60.85% | |
| Republican | Mark Leyva | 51,000 | 35.84% | |
| Libertarian | Donna Dunn | 4,714 | 3.31% | |
| Independent | James Johnson Jr. (Write-in) | 0 | 0.00% | |
| Total votes | 142,293 | 100.00% | ||
| Democratic hold | ||||
2016
| Party | Candidate | Votes | % | |
|---|---|---|---|---|
| Democratic | Pete Visclosky (Incumbent) | 207,514 | 81.51% | |
| Libertarian | Donna Dunn | 47,051 | 18.48% | |
| Independent | John Meyer | 17 | 0.00% | |
| Total votes | 254,583 | 100.00% | ||
| Democratic hold | ||||
2018
| Party | Candidate | Votes | % | |
|---|---|---|---|---|
| Democratic | Pete Visclosky (Incumbent) | 159,611 | 65.1% | |
| Republican | Mark Leyva | 85,594 | 34.9% | |
| Independent | Jonathan S. Kleinman (write-in) | 4 | 0.0% | |
| Total votes | 245,209 | 100.0% | ||
| Democratic hold | ||||
2020
| Party | Candidate | Votes | % | |
|---|---|---|---|---|
| Democratic | Frank J. Mrvan | 185,180 | 56.6% | |
| Republican | Mark Leyva | 132,247 | 40.5% | |
| Libertarian | Edward Michael Strauss | 9,521 | 2.9% | |
| Total votes | 326,948 | 100.0% | ||
| Democratic hold | ||||
See also
- Indiana's congressional districts
- List of United States congressional districts
Notes
- Supported the Jackson faction in the 1824 presidential election
References
- "My Congressional District".
- "2022 Cook PVI: District Map and List". The Cook Political Report. July 12, 2022. Retrieved July 21, 2022.
- Congressional Quarterly, p. 545
- Congressional Quarterly, p. 548
- Congressional Quarterly, p. 551
- Congressional Quarterly, p. 556
- Congressional Quarterly, p. 560
- Congressional Quarterly, p. 564
- Congressional Quarterly, p. 568
- Congressional Quarterly, p. 572
- Congressional Quarterly
- Congressional Quarterly, p. 578
- Congressional Quarterly, p. 582
- Congressional Quarterly, p. 585
- Congressional Quarterly, p. 589
- Congressional Quarterly, p. 593
- Congressional Quarterly, p. 595
- Congressional Quarterly, p. 598
- Congressional Quarterly, p. 601
- Congressional Quarterly, p. 605
- Congressional Quarterly, p. 607
- Congressional Quarterly, p. 610
- Congressional Quarterly, p. 616
- Congressional Quarterly, p. 619
- Congressional Quarterly, p. 623
- Congressional Quarterly, p. 626
- Congressional Quarterly, p. 630
- Congressional Quarterly, p. 634
- Congressional Quarterly, p. 638
- Congressional Quarterly, p. 642
- Congressional Quarterly, p. 646
- Congressional Quarterly, p. 650
- Congressional Quarterly, p. 654
- Congressional Quarterly, p. 658
- Congressional Quarterly, p. 662
- Congressional Quarterly, p. 667
- Congressional Quarterly, p. 672
- Congressional Quarterly, p. 677
- Congressional Quarterly, p. 682
- Congressional Quarterly, p. 687
- Congressional Quarterly, p. 690
- Congressional Quarterly, p. 696
- Congressional Quarterly, p. 693
- Congressional Quarterly, p. 702
- Congressional Quarterly, p. 710
- Congressional Quarterly, p. 718
- Congressional Quarterly, p. 723
- Congressional Quarterly, p. 729
- Congressional Quarterly, p. 736
- Congressional Quarterly, p. 741
- Congressional Quarterly, p. 747
- Congressional Quarterly, p. 751
- Congressional Quarterly, p. 756
- Congressional Quarterly, p. 761
- Congressional Quarterly, p. 766
- Congressional Quarterly, p. 771
- Congressional Quarterly, p. 776
- Congressional Quarterly, p. 781
- Congressional Quarterly, p. 786
- Congressional Quarterly, p. 791
- Congressional Quarterly, p. 801
- Congressional Quarterly, p. 806
- Congressional Quarterly, p. 811
- Congressional Quarterly, p. 816
- Congressional Quarterly, p. 821
- Congressional Quarterly, p. 826
- Congressional Quarterly, p. 831
- Congressional Quarterly, p. 836
- Congressional Quarterly, p. 842
- Congressional Quarterly, p. 847
- Congressional Quarterly, p. 852
- Congressional Quarterly, p. 857
- Congressional Quarterly, p. 862
- Congressional Quarterly, p. 867
- Congressional Quarterly, p. 872
- Congressional Quarterly, p. 877
- "STATISTICS OF THE PRESIDENTIAL AND CONGRESSIONAL ELECTION OF NOVEMBER, 2, 1976" (PDF). clerk.house.gov.
- "STATISTICS OF THE PRESIDENTIALAND CONGRESSIONAL ELECTION OF NOVEMBER, 7, 1978" (PDF). clerk.house.gov.
- "STATISTICS OF THE PRESIDENTIALAND CONGRESSIONAL ELECTION OF NOVEMBER 4, 1980" (PDF). clerk.house.gov.
- "Election Results". Indiana Elections Division. November 28, 2012. Retrieved December 30, 2012.
- "Secretary of State : Election Division: Election Results". in.gov. March 11, 2015. Retrieved September 13, 2017.
- Martis, Kenneth C. (1989). The Historical Atlas of Political Parties in the United States Congress. New York: Macmillan Publishing Company.
- Martis, Kenneth C. (1982). The Historical Atlas of United States Congressional Districts. New York: Macmillan Publishing Company.
- Congressional Biographical Directory of the United States 1774–present
- Congressional Quarterly's Guide to US Elections. Congressional Quarterly Inc. 1975. ISBN 0-87187-072-X.
External links
- Congressman Pete Visclosky official U.S. House website
Другой контент может иметь иную лицензию. Перед использованием материалов сайта WikiSort.org внимательно изучите правила лицензирования конкретных элементов наполнения сайта.
WikiSort.org - проект по пересортировке и дополнению контента Википедии