world.wikisort.org - USA
Connecticut's 1st congressional district is a congressional district in the U.S. state of Connecticut. Located in the north-central part of the state, the district is anchored by the state capital of Hartford. It encompasses much of central Connecticut and includes towns within Hartford, Litchfield, and Middlesex counties. With a PVI of D+11, it is the most Democratic district in Connecticut.
| Connecticut's 1st congressional district | |||
|---|---|---|---|
District boundaries | |||
| Representative |
| ||
| Area | 673 sq mi (1,740 km2) | ||
| Distribution |
| ||
| Population (2021) | 716,422 | ||
| Median household income | $79,242[1] | ||
| Ethnicity |
| ||
| Cook PVI | D+11[2] | ||


Principal cities include: Bristol, Hartford, and Torrington.
The district has been represented by Democrat John B. Larson since 1999.
Towns in the district
Hartford County – Berlin, Bloomfield, Bristol, East Granby, East Hartford, East Windsor, Glastonbury (part), Granby, Hartford, Hartland, Manchester, Newington, Rocky Hill, Southington, South Windsor, West Hartford, Wethersfield, Windsor, and Windsor Locks.
Litchfield County – Barkhamsted, Colebrook, New Hartford, Torrington (part), and Winchester.
Middlesex County – Cromwell, Middletown (part), and Portland.
Voter registration
| Voter Registration and Party Enrollment as of October 30, 2012[3] | |||||
|---|---|---|---|---|---|
| Party | Active Voters | Inactive Voters | Total Voters | Percentage | |
| Democratic | 156,784 | 11,392 | 168,176 | 40.39% | |
| Republican | 71,932 | 3,348 | 75,280 | 18.08% | |
| Minor Parties | 301 | 29 | 330 | 0.07% | |
| Unaffiliated | 161,327 | 11,299 | 172,626 | 41.46% | |
| Total | 390,334 | 26,068 | 416,412 | 100% | |
Recent presidential elections
| Election results from presidential races | ||
|---|---|---|
| Year | Office | Results |
| 2000 | President | Gore 62–33% |
| 2004 | President | Kerry 60–39% |
| 2008 | President | Obama 66–33% |
| 2012 | President | Obama 63–36% |
| 2016 | President | Clinton 59–36% |
| 2020 | President | Biden 63–35% |
Recent elections
The district has the lowest Republican voter performance of the five Connecticut house seats. It has been in Democratic hands without interruption since 1957, and for all but six years since 1931.
| Party | Candidate | Votes | % | ±% | |
|---|---|---|---|---|---|
| Democratic | Barbara B. Kennelly (inc.) | 176,463 | 77% | ||
| Republican | Mario Robles, Jr. | 51,985 | 23% | ||
| Democratic hold | Swing | ||||
| Turnout | 228,448 | 100% | |||
| Party | Candidate | Votes | % | ±% | |
|---|---|---|---|---|---|
| Democratic | Barbara B. Kennelly (inc.) | 126,566 | 71% | ||
| Republican | James P. Garvey | 50,690 | 29% | ||
| Democratic hold | Swing | ||||
| Turnout | 177,256 | 100% | |||
| Party | Candidate | Votes | % | ±% | |
|---|---|---|---|---|---|
| Democratic | Barbara B. Kennelly (inc.) | 164,735 | 67% | ||
| Republican | Phillip Steele | 75,113 | 31% | ||
| Concerned Citizens | Gary Garneau | 5,577 | 2% | ||
| Democratic hold | Swing | ||||
| Turnout | 245,425 | 100% | |||
| Party | Candidate | Votes | % | ±% | |
|---|---|---|---|---|---|
| Democratic | Barbara B. Kennelly (inc.) | 139,637 | 74% | ||
| Republican | Douglas T. Putnam | 46,865 | 24% | ||
| Concerned Citizens | John F. Forry, III | 3,405 | 2% | ||
| Democratic hold | Swing | ||||
| Turnout | 188,907 | 100% | |||
| Party | Candidate | Votes | % | ±% | |
|---|---|---|---|---|---|
| Democratic | Barbara B. Kennelly (inc.) | 158,222 | 74% | ||
| Republican | Kent Sleath | 53,666 | 24% | ||
| Concerned Citizens | John F. Forry, III | 2,099 | 1% | ||
| Natural Law | Daniel A. Wasielewski | 1,149 | 1% | ||
| Democratic hold | Swing | ||||
| Turnout | 215,136 | 100% | |||
| Party | Candidate | Votes | % | ±% | |
|---|---|---|---|---|---|
| Democratic | John B. Larson | 97,681 | 58% | ||
| Republican | Kevin O'Connor | 69,668 | 41% | ||
| Term Limits | Jay E. Palmieri, IV | 915 | 1% | ||
| Democratic hold | Swing | ||||
| Turnout | 168,264 | 100% | |||
| Party | Candidate | Votes | % | ±% | |
|---|---|---|---|---|---|
| Democratic | John B. Larson (inc.) | 151,932 | 72% | ||
| Republican | Robert Backlund | 59,331 | 28% | ||
| Democratic hold | Swing | ||||
| Turnout | 211,263 | 100% | |||
| Party | Candidate | Votes | % | ±% | |
|---|---|---|---|---|---|
| Democratic | John B. Larson (inc.) | 134,698 | 67% | ||
| Republican | Phil Steele | 66,968 | 33% | ||
| Democratic hold | Swing | ||||
| Turnout | 201,666 | 100% | |||
| Party | Candidate | Votes | % | ±% | |
|---|---|---|---|---|---|
| Democratic | John B. Larson (inc.) | 197,964 | 73% | ||
| Republican | John Halstead | 73,272 | 27% | ||
| Democratic hold | Swing | ||||
| Turnout | 271,237 | 100% | |||
| Party | Candidate | Votes | % | ±% | |
|---|---|---|---|---|---|
| Democratic | John B. Larson (inc.) | 154,539 | 74% | ||
| Republican | Scott MacLean | 53,010 | 26% | ||
| Democratic hold | Swing | ||||
| Turnout | 207,549 | 100% | |||
| Party | Candidate | Votes | % | ±% | |
|---|---|---|---|---|---|
| Democratic | John B. Larson (inc.) | 211,563 | 72% | ||
| Republican | Joe Visconti | 76,851 | 26% | ||
| Green | Stephen Fournier | 7,199 | 2% | ||
| Democratic hold | Swing | ||||
| Turnout | 295,613 | 100% | |||
| Party | Candidate | Votes | % | ±% | |
|---|---|---|---|---|---|
| Democratic | John B. Larson (inc.) | 138,440 | 61% | ||
| Republican | Ann Brickley | 84,076 | 37% | ||
| Green | Kenneth J. Krayeske | 2,564 | 1% | ||
| Socialist Action | Christopher Hutchinson | 955 | 0.42% | ||
| Democratic hold | Swing | ||||
| Turnout | 226,035 | 100% | |||
| Party | Candidate | Votes | % | ±% | |
|---|---|---|---|---|---|
| Democratic | John B. Larson (inc.) | 206,575 | 70% | ||
| Republican | John Henry Decker | 82,262 | 28% | ||
| Green | Michael DeRosa | 5,746 | 2% | ||
| Democratic hold | Swing | ||||
| Turnout | 294,583 | 100% | |||
| Party | Candidate | Votes | % | ±% | |
|---|---|---|---|---|---|
| Democratic | John B. Larson (inc.) | 135,825 | 62% | ||
| Republican | Matthew Corey | 78,609 | 36% | ||
| Green | Jeff Russell | 3,447 | 2% | ||
| Democratic hold | Swing | ||||
| Turnout | 217,881 | 100% | |||
| Party | Candidate | Votes | % | ±% | |
|---|---|---|---|---|---|
| Democratic | John B. Larson (inc.) | 188,286 | 64% | ||
| Republican | Matthew Corey | 100,976 | 34% | ||
| Green | Mike De Rosa | 6,031 | 2% | ||
| Democratic hold | Swing | ||||
| Turnout | 295,293 | 100% | |||
| Party | Candidate | Votes | % | ±% | |
|---|---|---|---|---|---|
| Democratic | John B. Larson (inc.) | 175,087 | 63% | ||
| Republican | Jennifer Nye | 96,024 | 35% | ||
| Green | Tom McCormick | 3,029 | 1% | ||
| Democratic hold | Swing | ||||
| Turnout | 274,140 | 100% | |||
| Party | Candidate | Votes | % | |
|---|---|---|---|---|
| Democratic | John B. Larson (inc.) | 222,668 | 64% | |
| Republican | Mary Fay | 122,111 | 35% | |
| Green | Tom McCormick | 4,458 | 1% | |
| Total votes | 349,237 | 100% | ||
| Democratic hold | ||||
List of members representing the district
| Member | Party | Years | Cong ress |
Electoral history |
|---|---|---|---|---|
 Isaac Toucey |
Democratic | March 4, 1837 – March 3, 1839 |
25th | Redistricted from the at-large district and re-elected in 1837. Lost re-election. |
 Joseph Trumbull |
Whig | March 4, 1839 – March 3, 1843 |
26th 27th |
Elected in 1839. Re-elected in 1840. Retired. |
 Thomas H. Seymour |
Democratic | March 4, 1843 – March 3, 1845 |
28th | Elected in 1843. Retired. |
 James Dixon |
Whig | March 4, 1845 – March 3, 1849 |
29th 30th |
Elected in 1845. Re-elected in 1847. Retired. |
 Loren P. Waldo |
Democratic | March 4, 1849 – March 3, 1851 |
31st | Elected in 1849. Lost re-election. |
 Charles Chapman |
Whig | March 4, 1851 – March 3, 1853 |
32nd | Elected in 1851. Retired to run for Governor. |
 James T. Pratt |
Democratic | March 4, 1853 – March 3, 1855 |
33rd | Elected in 1853. Lost re-election. |
 Ezra Clark Jr. |
American | March 4, 1855 – March 3, 1857 |
34th 35th |
Elected in 1855. Re-elected in 1857. Lost re-election. |
| Republican | March 4, 1857 – March 3, 1859 | |||
 Dwight Loomis |
Republican | March 4, 1859 – March 3, 1863 |
36th 37th |
Elected in 1859. Re-elected in 1861. Retired. |
 Henry C. Deming |
Republican | March 4, 1863 – March 3, 1867 |
38th 39th |
Elected in 1863. Re-elected in 1865. Lost re-election. |
 Richard D. Hubbard |
Democratic | March 4, 1867 – March 3, 1869 |
40th | Elected in 1867. Retired. |
| Julius L. Strong | Republican | March 4, 1869 – September 7, 1872 |
41st 42nd |
Elected in 1869. Re-elected in 1871. Died. |
| Vacant | September 7, 1872 – December 2, 1872 |
42nd | ||
 Joseph Roswell Hawley |
Republican | December 2, 1872 – March 3, 1875 |
42nd 43rd |
Elected to finish Strong's term. Re-elected in 1873. Lost re-election. |
 George M. Landers |
Democratic | March 4, 1875 – March 3, 1879 |
44th 45th |
Elected in 1875. Re-elected in 1876. Retired. |
Joseph Roswell Hawley |
Republican | March 4, 1879 – March 3, 1881 |
46th | Elected in 1878. Retired when elected U.S. Senator. |
 John R. Buck |
Republican | March 4, 1881 – March 3, 1883 |
47th | Elected in 1880. Lost re-election. |
 William W. Eaton |
Democratic | March 4, 1883 – March 3, 1885 |
48th | Elected in 1882. Lost re-election. |
John R. Buck |
Republican | March 4, 1885 – March 3, 1887 |
49th | Elected in 1884. Lost re-election. |
 Robert J. Vance |
Democratic | March 4, 1887 – March 3, 1889 |
50th | Elected in 1886. Lost re-election. |
 William E. Simonds |
Republican | March 4, 1889 – March 3, 1891 |
51st | Elected in 1888. Lost re-election. |
 Lewis Sperry |
Democratic | March 4, 1891 – March 3, 1895 |
52nd 53rd |
Elected in 1890. Re-elected in 1892. Lost re-election. |
 E. Stevens Henry |
Republican | March 4, 1895 – March 3, 1913 |
54th 55th 56th 57th 58th 59th 60th 61st 62nd |
Elected in 1894. Re-elected in 1896. Re-elected in 1898. Re-elected in 1900. Re-elected in 1902. Re-elected in 1904. Re-elected in 1906. Re-elected in 1908. Re-elected in 1910. Retired. |
 Augustine Lonergan |
Democratic | March 4, 1913 – March 3, 1915 |
63rd | Elected in 1912. Lost re-election. |
 P. Davis Oakey |
Republican | March 4, 1915 – March 3, 1917 |
64th | Elected in 1914. Lost re-election. |
Augustine Lonergan |
Democratic | March 4, 1917 – March 3, 1921 |
65th 66th |
Elected in 1916. Re-elected in 1918. Retired to run for U.S. Senator. |
 E. Hart Fenn |
Republican | March 4, 1921 – March 3, 1931 |
67th 68th 69th 70th 71st |
Elected in 1920. Re-elected in 1922. Re-elected in 1924. Re-elected in 1926. Re-elected in 1928. Retired. |
Augustine Lonergan |
Democratic | March 4, 1931 – March 3, 1933 |
72nd | Elected in 1930. Retired when elected to the US Senate |
 Herman P. Kopplemann |
Democratic | March 4, 1933 – January 3, 1939 |
73rd 74th 75th |
Elected in 1932. Re-elected in 1934. Re-elected in 1936. Lost re-election. |
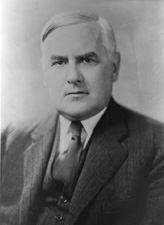
 William J. Miller |
Republican | January 3, 1939 – January 3, 1941 |
76th | Elected in 1938. Lost re-election. |
Herman P. Kopplemann |
Democratic | January 3, 1941 – January 3, 1943 |
77th | Elected in 1940. Lost re-election. |
William J. Miller |
Republican | January 3, 1943 – January 3, 1945 |
78th | Elected in 1942. Lost re-election. |
Herman P. Kopplemann |
Democratic | January 3, 1945 – January 3, 1947 |
79th | Elected in 1944. Lost re-election. |
William J. Miller |
Republican | January 3, 1947 – January 3, 1949 |
80th | Elected in 1946. Lost re-election. |
 Abraham Ribicoff |
Democratic | January 3, 1949 – January 3, 1953 |
81st 82nd |
Elected in 1948. Re-elected in 1950. Retired to run for U.S. Senator. |
 Thomas J. Dodd |
Democratic | January 3, 1953 – January 3, 1957 |
83rd 84th |
Elected in 1952. Re-elected in 1954. Retired to run for U.S. Senator. |
 Edwin H. May Jr. |
Republican | January 3, 1957 – January 3, 1959 |
85th | Elected in 1956. Lost re-election. |
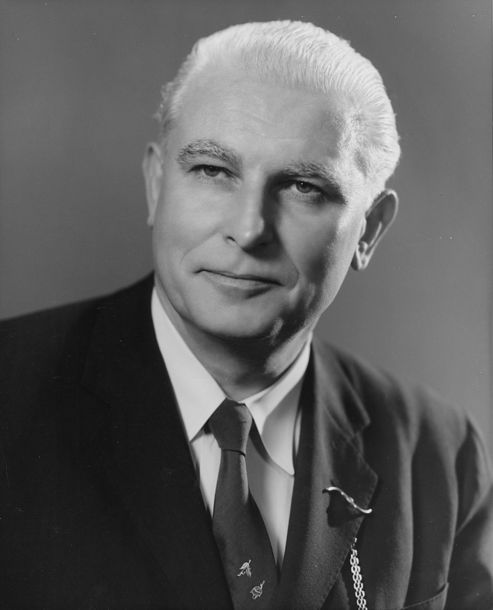
 Emilio Q. Daddario |
Democratic | January 3, 1959 – January 3, 1971 |
86th 87th 88th 89th 90th 91st |
Elected in 1958. Re-elected in 1960. Re-elected in 1962. Re-elected in 1964. Re-elected in 1966. Re-elected in 1968. Retired to run for Governor. |
 William R. Cotter |
Democratic | January 3, 1971 – September 8, 1981 |
92nd 93rd 94th 95th 96th 97th |
Elected in 1970. Re-elected in 1972. Re-elected in 1974. Re-elected in 1976. Re-elected in 1978. Re-elected in 1980. Died. |
| Vacant | September 9, 1981 – January 11, 1982 |
97th | ||
 Barbara B. Kennelly |
Democratic | January 12, 1982 – January 3, 1999 |
97th 98th 99th 100th 101st 102nd 103rd 104th 105th |
Elected to finish Cotter's term. Re-elected in 1982. Re-elected in 1984. Re-elected in 1986. Re-elected in 1988. Re-elected in 1990. Re-elected in 1992. Re-elected in 1994. Re-elected in 1996. Retired to run for Governor. |
 John B. Larson |
Democratic | January 3, 1999 – Present |
106th 107th 108th 109th 110th 111th 112th 113th 114th 115th 116th 117th |
Elected in 1998. Re-elected in 2000. Re-elected in 2002. Re-elected in 2004. Re-elected in 2006. Re-elected in 2008. Re-elected in 2010. Re-elected in 2012. Re-elected in 2014. Re-elected in 2016. Re-elected in 2018. Re-elected in 2020. Re-elected in 2022. |

References
- "My Congressional District".
- "Introducing the 2021 Cook Political Report Partisan Voter Index". The Cook Political Report. April 15, 2021. Retrieved April 15, 2021.
- "Registration and Party Enrollment Statistics as of October 30, 2012" (PDF). Connecticut Secretary of State. Archived from the original (PDF) on September 23, 2006. Retrieved October 30, 2012.
- Martis, Kenneth C. (1989). The Historical Atlas of Political Parties in the United States Congress. New York: Macmillan Publishing Company.
- Martis, Kenneth C. (1982). The Historical Atlas of United States Congressional Districts. New York: Macmillan Publishing Company.
- Congressional Biographical Directory of the United States 1774–present
Другой контент может иметь иную лицензию. Перед использованием материалов сайта WikiSort.org внимательно изучите правила лицензирования конкретных элементов наполнения сайта.
WikiSort.org - проект по пересортировке и дополнению контента Википедии