world.wikisort.org - USA
Colorado's 6th congressional district is a congressional district in the U.S. state of Colorado. Located in central Colorado, the district encompasses much of the eastern part of the Denver metropolitan area, including all of Aurora, as well as portions of the southern (Centennial and Littleton) and northern metro area (Brighton and Henderson).
| Colorado's 6th congressional district | |||
|---|---|---|---|
District boundaries | |||
| Representative |
| ||
| Distribution |
| ||
| Population (2021) | 833,948[2] | ||
| Median household income | $92,522[3] | ||
| Ethnicity |
| ||
| Cook PVI | D+6 (D+8 post redistricting) [4] | ||


The district is currently represented by Democrat Jason Crow.
The district was created in 1983 as a result of the redistricting cycle after the 1980 Census, and was originally a classic suburban Republican bastion; this was once the safest seat for Colorado Republicans outside of Colorado Springs. However, changing demographics in the Front Range, especially in Arapahoe County which went from a traditional conservative suburban/exurban stronghold to a densely populated, ethnically and culturally diverse Democratic-leaning inner suburban county, has made suburban Denver much friendlier to Democrats. The 2010 redistricting shifted the more rural, GOP-dominated sections of the district to the nearby 4th and added heavily populated and Democratic parts of Aurora, turning the 6th district into a Democratic-leaning swing district. However, Republicans are still competitive downballot, and the Democratic strength was limited to western Arapahoe County for much of its history, as the components of Douglas County and Adams County in the 6th were still Republican leaning: this changed in 2020, as Joe Biden and Representative Jason Crow won all county areas in the district.
After the 2020 redistricting, the 6th will become a purely inner suburban district anchored in western Arapahoe County, however small parts of Jefferson, Douglas, and Adams Counties will be included as well to completely take in the cities of Littleton and Aurora.
History
1990s
Following the 1990 U.S. Census and associated realignment of Colorado congressional districts, the 6th Congressional district consisted of portions of Arapahoe and Jefferson counties.
2000s
Following the 2000 U.S. Census and associated realignment of Colorado congressional districts, the 6th Congressional district consisted of Douglas and Elbert counties as well as portions of Arapahoe, Jefferson, and Park counties.
2010s
During the 2010 Colorado Redistricting, the 6th Congressional district lost most of its previous area; the district now consisted of the western portions of Arapahoe and Adams counties plus the community of Highlands Ranch in Douglas County and a very little part of Jefferson County.
2020s
During the 2020 Colorado Redistricting, the 6th Congressional district became a pure inner-suburban district consisting of western Arapahoe County, the portions of the City of Aurora located in Adams and Douglas counties, as well as parts of Jefferson County bordering Littleton near Highway 470.
Characteristics
A suburban swing district anchored by Aurora, Republicans are the strongest in the Adams County and Douglas County portions of the district, while the Democrats are strongest in the Arapahoe suburbs.
While Adams County leans Democratic, most of the denser and more populated areas of the county lie in the 7th congressional district, leaving the more Republican leaning parts of the county in the district such as Brighton and Henderson: similarly, while Douglas County is a Republican stronghold, the parts of the county in the 6th, such as Highlands Ranch, is not nearly as Republican as the rest of the county and is slowly swinging towards the Democrats. [citation needed]
Arapahoe County makes up the bulk of the population and is historically a mixed bag, though it has been becoming a Democratic stronghold as of late. Aurora, a racially and economically diverse city, provides a large base for the Democrats, although not uniformly throughout the city: central Aurora near I-225 is one of the most Democratic parts of Colorado and votes similarly to neighboring parts of Denver, however the further parts of the city are far more competitive between parties. Similarly, Englewood and Sheridan are strongly Democratic due to their sociological and economic proximity to nearby Denver neighborhoods. The more southern and eastern parts of the county were formerly Republican strongholds, however have swung rapidly to the Democrats in recent years, as cities such as Centennial and Littleton swung from high single digit cities for McCain and Romney to mild wins for Clinton and double digit wins for Biden.[citation needed] Similarly, the district's PVI has changed from R+1 when it was first drawn to a D+6 district in its current iteration.
Voting
Election results from presidential races[5]
| Election results from presidential races | ||
|---|---|---|
| Year | Office | Results |
| 2000 | President | Bush 60–37% |
| 2004 | President | Bush 60–39% |
| 2008 | President | McCain 53–46% |
| 2012 | President | Obama 52–47% |
| 2016 | President | Clinton 50–41% |
| 2020 | President | Biden 58–39% |
List of members representing the district
| Representative (Residency) |
Party | Years | Cong ress(es) |
Electoral history | District location |
|---|---|---|---|---|---|
| District created January 3, 1983. | |||||
| Vacant | January 3, 1983 – March 29, 1983 |
98th | Representative-elect Jack Swigert died December 27, 1982.[6] | 1983–1993 Parts of Adams, Arapahoe, Denver, and Jefferson | |
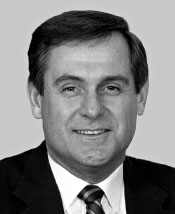 Dan Schaefer (Wheat Ridge) |
Republican | March 29, 1983 – January 3, 1999 |
98th 99th 100th 101st 102nd 103rd 104th 105th |
Elected to finish Swigert's term. Re-elected in 1984. Re-elected in 1986. Re-elected in 1988. Re-elected in 1990. Re-elected in 1992. Re-elected in 1994. Re-elected in 1996. Retired. | |
| 1993–2003 Parts of Arapahoe and Jefferson | |||||
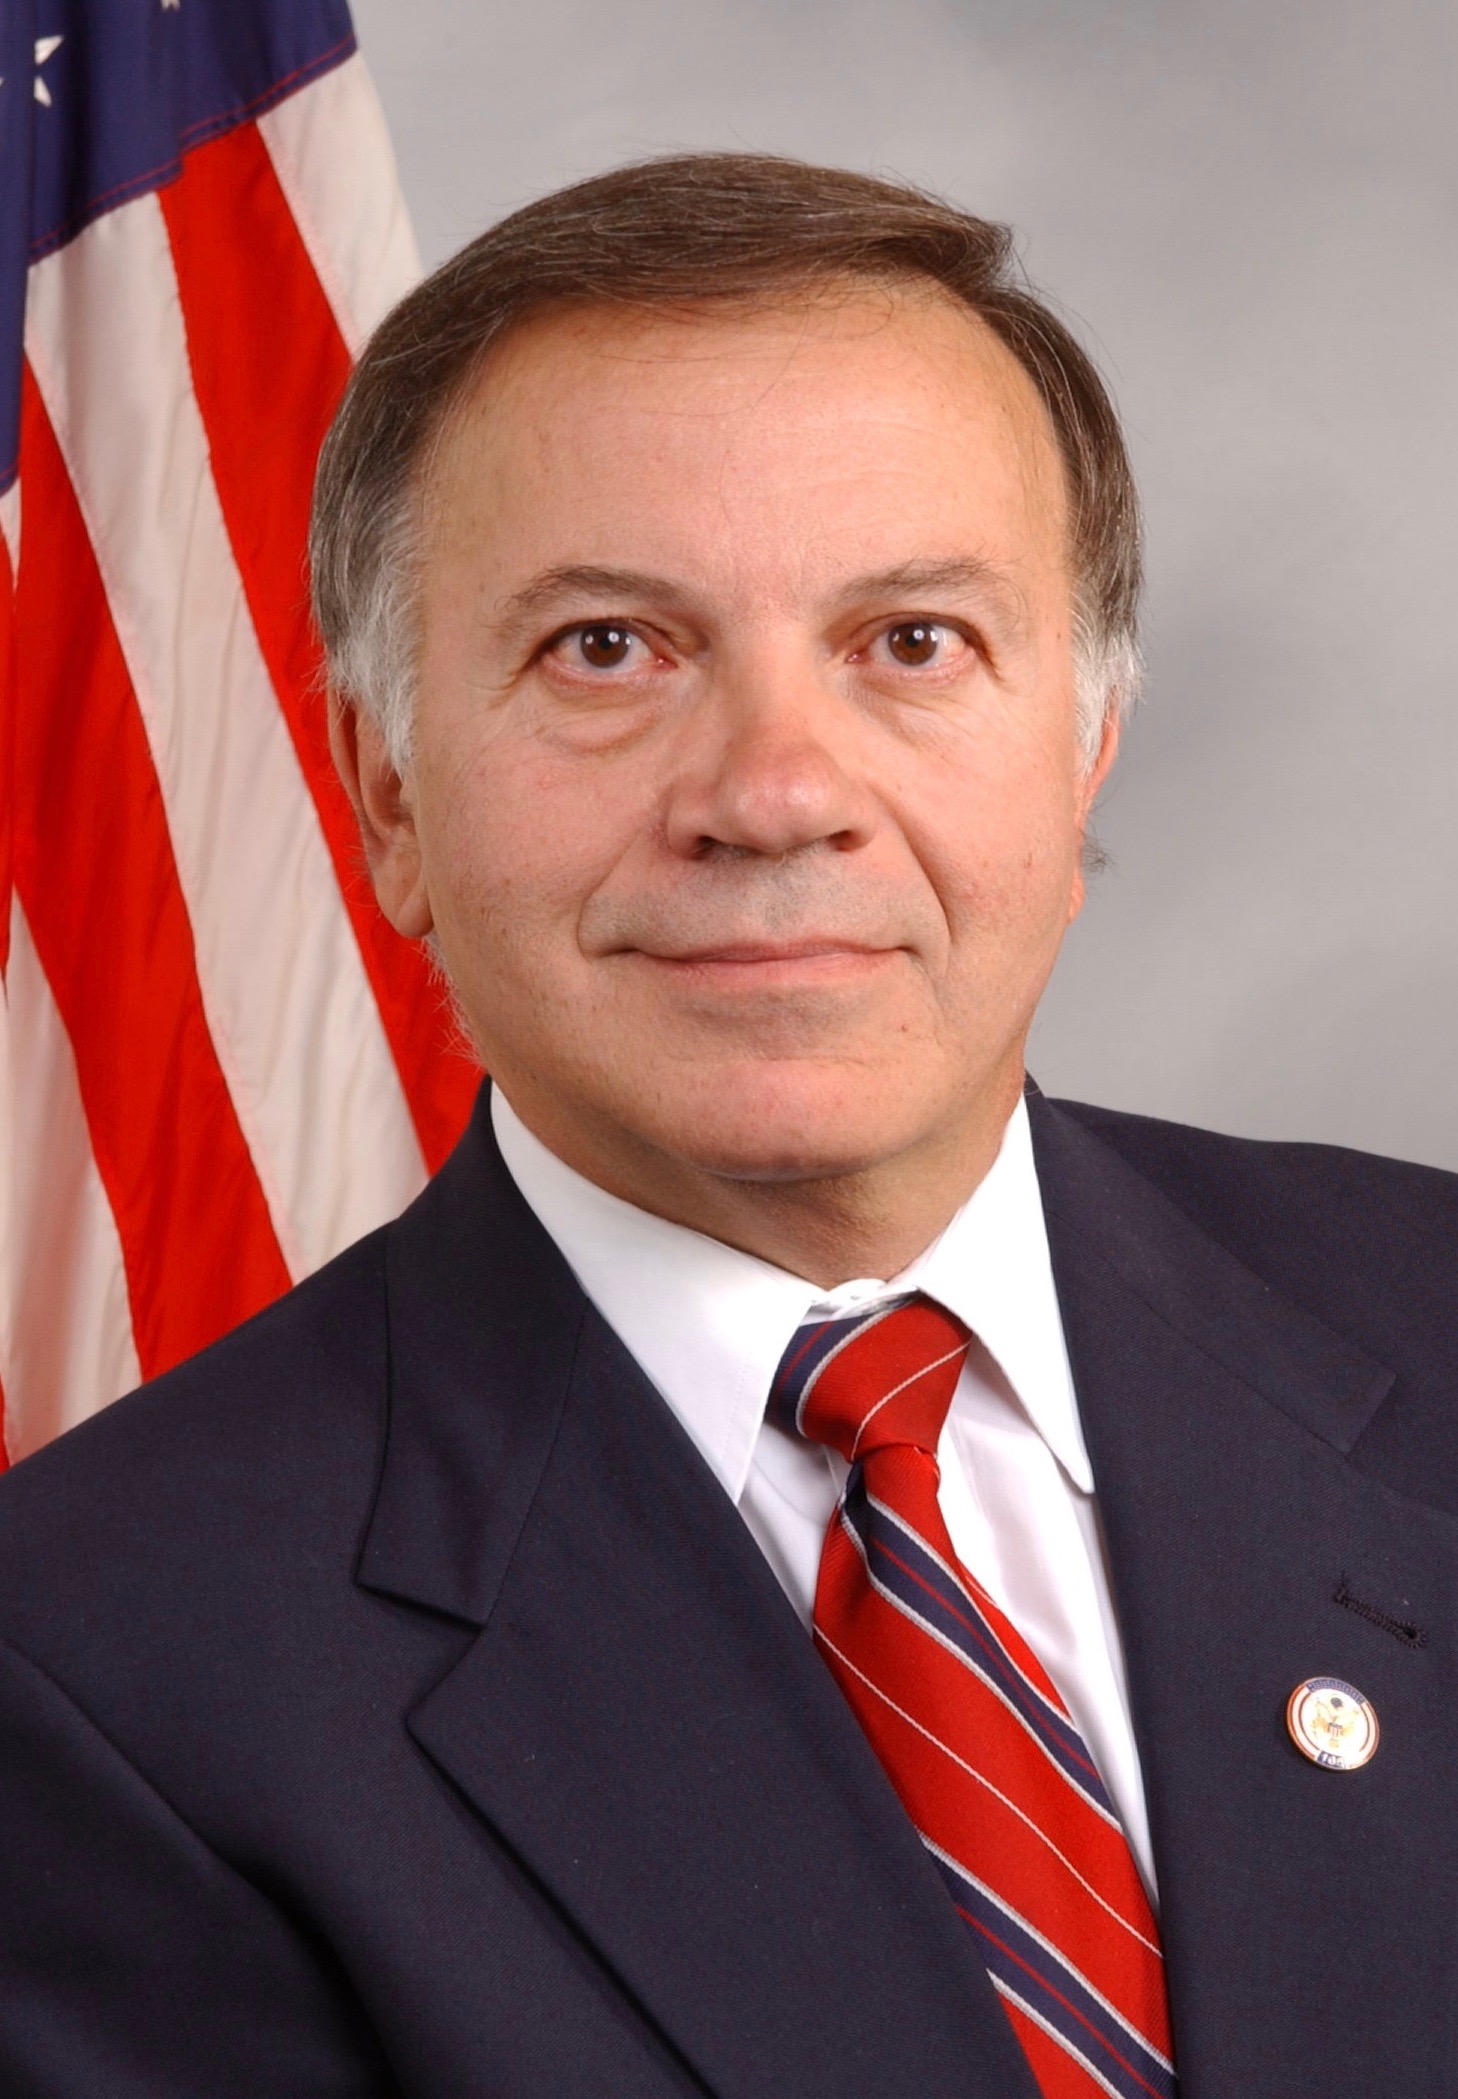 Tom Tancredo (Littleton) |
Republican | January 3, 1999 – January 3, 2009 |
106th 107th 108th 109th 110th |
Elected in 1998. Re-elected in 2000. Re-elected in 2002. Re-elected in 2004. Re-elected in 2006. Retired. | |
2003–2013 Douglas and Elbert; parts of Arapahoe, Jefferson, and Park | |||||
 Mike Coffman (Aurora) |
Republican | January 3, 2009 – January 3, 2019 |
111th 112th 113th 114th 115th |
Elected in 2008. Re-elected in 2010. Re-elected in 2012. Re-elected in 2014. Re-elected in 2016. Lost re-election. | |
2013–present Parts of Adams, Arapahoe, and Douglas | |||||
 Jason Crow (Centennial) |
Democratic | January 3, 2019 – present |
116th 117th |
Elected in 2018. Re-elected in 2020. Re-elected in 2022. | |
Election results
|
1982 • 1983 (Special) • 1984 • 1986 • 1988 • 1990 • 1992 • 1994 • 1996 • 1998 • 2000 • 2002 • 2004 • 2006 • 2008 • 2010 • 2012 • 2014 • 2016 • 2018 • 2020 |
1982
| Party | Candidate | Votes | % | ||
|---|---|---|---|---|---|
| Republican | Jack Swigert | 98,909 | 62.16% | ||
| Democratic | Steve Hogan | 56,598 | 35.57% | ||
| Libertarian | J. Craig Green | 3,605 | 2.27% | ||
| Total votes | 159,112 | 100% | |||
| Republican win (new seat) | |||||
1983 (Special)
| Party | Candidate | Votes | % | |
|---|---|---|---|---|
| Republican | Daniel Schaefer | 49,816 | 63.29% | |
| Democratic | Steve Hogan | 27,779 | 35.29% | |
| Concerns of People Party | John Heckman | 1,112 | 1.41% | |
| Total votes | 78,707 | 100% | ||
| Republican hold | ||||
1984
| Party | Candidate | Votes | % | |
|---|---|---|---|---|
| Republican | Daniel Schaefer (incumbent) | 171,427 | 89.40% | |
| Concerns of People Party | John Heckman | 20,333 | 10.60% | |
| Total votes | 191,760 | 100% | ||
| Republican hold | ||||
1986
| Party | Candidate | Votes | % | |
|---|---|---|---|---|
| Republican | Daniel Schaefer (incumbent) | 104,359 | 63.04% | |
| Democratic | Chuck Norris | 58,834 | 35.54% | |
| Concerns of People Party | John Heckman | 2,338 | 1.41% | |
| Total votes | 165,531 | 100% | ||
| Republican hold | ||||
1988
| Party | Candidate | Votes | % | |
|---|---|---|---|---|
| Republican | Daniel Schaefer (incumbent) | 136,487 | 63.03% | |
| Democratic | Martha Ezzard | 77,158 | 35.63% | |
| Concerns of People Party | John Heckman | 2,911 | 1.34% | |
| Total votes | 216,556 | 100% | ||
| Republican hold | ||||
1990
| Party | Candidate | Votes | % | |
|---|---|---|---|---|
| Republican | Daniel Schaefer (incumbent) | 105,312 | 64.50% | |
| Democratic | Don Jarrett | 57,961 | 35.50% | |
| Total votes | 163,273 | 100% | ||
| Republican hold | ||||
1992
| Party | Candidate | Votes | % | |
|---|---|---|---|---|
| Republican | Daniel Schaefer (incumbent) | 142,021 | 60.93% | |
| Democratic | Tom Kolbe | 91,073 | 39.07% | |
| Prohibition | Earl Higgerson (write-in) | 3 | 0.00% | |
| Total votes | 233,097 | 100% | ||
| Republican hold | ||||
1994
| Party | Candidate | Votes | % | |
|---|---|---|---|---|
| Republican | Daniel Schaefer (incumbent) | 124,079 | 69.82% | |
| Democratic | John Hallen | 49,701 | 27.97% | |
| Concerns of People Party | John Heckman | 2,536 | 1.43% | |
| Natural Law | Stephen D. Dawson | 1,393 | 0.78% | |
| Total votes | 177,709 | 100% | ||
| Republican hold | ||||
1996
| Party | Candidate | Votes | % | |
|---|---|---|---|---|
| Republican | Daniel Schaefer (incumbent) | 146,018 | 62.24% | |
| Democratic | Joan Fitz-Gerald | 88,600 | 37.76% | |
| Total votes | 234,618 | 100% | ||
| Republican hold | ||||
1998
| Party | Candidate | Votes | % | |
|---|---|---|---|---|
| Republican | Tom Tancredo | 111,374 | 55.91% | |
| Democratic | Henry L. Strauss | 82,622 | 41.48% | |
| Natural Law | George E. Newman | 5,152 | 2.59% | |
| Total votes | 199,188 | 100% | ||
| Republican hold | ||||
2000
| Party | Candidate | Votes | % | |
|---|---|---|---|---|
| Republican | Tom Tancredo (incumbent) | 141,410 | 53.88% | |
| Democratic | Kenneth A. Toltz | 110,568 | 42.12% | |
| Libertarian | Adam David Katz | 6,882 | 2.62% | |
| Concerns of People Party | John Heckman | 3,614 | 1.38% | |
| Total votes | 262,477 | 100% | ||
| Republican hold | ||||
2002
| Party | Candidate | Votes | % | |
|---|---|---|---|---|
| Republican | Tom Tancredo (incumbent) | 158,851 | 66.88% | |
| Democratic | Lance Wright | 71,327 | 30.03% | |
| Libertarian | Adam David Katz | 7,323 | 3.08% | |
| Total votes | 237,501 | 100% | ||
| Republican hold | ||||
2004
| Party | Candidate | Votes | % | |
|---|---|---|---|---|
| Republican | Tom Tancredo (incumbent) | 212,778 | 59.48% | |
| Democratic | Joanna Conti | 139,870 | 39.10% | |
| Libertarian | Jack J. Woehr | 3,857 | 1.08% | |
| Constitution | Peter Shevchuck | 1,235 | 0.35% | |
| Total votes | 357,741 | 100% | ||
| Republican hold | ||||
2006
| Party | Candidate | Votes | % | |
|---|---|---|---|---|
| Republican | Tom Tancredo (incumbent) | 158,806 | 58.61% | |
| Democratic | Bill Winter | 108,007 | 39.87% | |
| Libertarian | Jack J. Woehr | 4,093 | 1.51% | |
| Republican | Juan B. Botero (write-in) | 25 | 0.01% | |
| Total votes | 270,931 | 100% | ||
| Republican hold | ||||
2008
Republican primary
| Party | Candidate | Votes | % | |
|---|---|---|---|---|
| Republican | Mike Coffman | 28,509 | 40.12% | |
| Republican | Wil Armstrong | 23,213 | 32.67% | |
| Republican | Ted Harvey | 10,886 | 15.32% | |
| Republican | Steve Ward | 8,452 | 11.89% | |
| Total votes | 71,060 | 100% | ||
General election
| Party | Candidate | Votes | % | |
|---|---|---|---|---|
| Republican | Mike Coffman | 250,877 | 60.67% | |
| Democratic | Hank Eng | 162,641 | 39.33% | |
| Total votes | 413,516 | 100% | ||
| Republican hold | ||||
2010
| Party | Candidate | Votes | % | |
|---|---|---|---|---|
| Republican | Mike Coffman (incumbent) | 217,400 | 65.67% | |
| Democratic | John Flerlage | 104,159 | 31.46% | |
| Libertarian | Rob McNealy | 9,471 | 2.86% | |
| Write-in | Michael Shawn Kearns | 7 | 0.00% | |
| Total votes | 331,037 | 100% | ||
| Republican hold | ||||
2012
| Party | Candidate | Votes | % | |
|---|---|---|---|---|
| Republican | Mike Coffman (incumbent) | 163,938 | 47.81% | |
| Democratic | Joe Miklosi | 156,937 | 45.77% | |
| Libertarian | Patrick E. Provost | 8,597 | 2.51% | |
| UNA | Kathy Polhemus | 13,442 | 3.92% | |
| Total votes | 342,914 | 100% | ||
| Republican hold | ||||
2014
| Party | Candidate | Votes | % | |
|---|---|---|---|---|
| Republican | Mike Coffman (incumbent) | 143,467 | 51.90% | |
| Democratic | Andrew Romanoff | 118,847 | 42.99% | |
| Libertarian | Norm Olsen | 8,623 | 3.12% | |
| Green | Gary Swing | 5,503 | 1.99% | |
| Total votes | 276,440 | 100% | ||
| Republican hold | ||||
2016
| Party | Candidate | Votes | % | |
|---|---|---|---|---|
| Republican | Mike Coffman (incumbent) | 191,626 | 50.91% | |
| Democratic | Morgan Carroll | 160,372 | 42.60% | |
| Libertarian | Norm Olsen | 18,778 | 4.99% | |
| Green | Robert Lee Worthey | 5,641 | 1.50% | |
| Total votes | 376,417 | 100% | ||
| Republican hold | ||||
2018
| Party | Candidate | Votes | % | |||
|---|---|---|---|---|---|---|
| Democratic | Jason Crow | 184,399 | 54.08% | |||
| Republican | Mike Coffman (incumbent) | 146,339 | 42.92% | |||
| Libertarian | Kat Martin | 5,733 | 1.68% | |||
| Independent | Dan Chapin | 4,512 | 1.32% | |||
| Total votes | 340,983 | 100% | ||||
| Democratic gain from Republican | ||||||
2020
| Party | Candidate | Votes | % | |
|---|---|---|---|---|
| Democratic | Jason Crow (incumbent) | 250,314 | 57.09% | |
| Republican | Steve House | 175,192 | 39.96% | |
| Libertarian | Norm Olsen | 9,083 | 2.07% | |
| Unity | Jaimie Kulikowski | 3,884 | 0.89% | |
| Total votes | 438,473 | 100% | ||
| Democratic hold | ||||
Historical district boundaries

See also
- Colorado's congressional districts
- List of United States congressional districts
References
- "Congressional Districts Relationship Files (State-based)". U.S. Census Bureau. Archived from the original on April 2, 2013.
- "My Congressional District".
- "My Congressional District".
- "Introducing the 2021 Cook Political Report Partisan Voter Index". The Cook Political Report. April 15, 2021. Retrieved April 15, 2021.
- Presidential Election Results, by district, swingstateproject.com
- "Ex-Astronaut, Newly Elected to House, Dies". The Times. Shreveport, Louisiana. Associated Press. December 29, 1982. p. 12D – via Newspapers.com.
- 1982 Election Results
- 1983 Special Election Results
- 1984 Election Results
- 1986 Election Results
- 1988 Election Results
- 1990 Election Results
- 1992 Election Results
- 1994 Election Results
- 1996 Election Results
- 1998 Election Results
- 2000 Election Results
- 2002 Election Results
- 2004 Election Results
- 2006 Election Results
- 2008 Primary Results[permanent dead link]
- 2008 Election Results
- "2010 Election Results". Archived from the original on November 29, 2010. Retrieved July 21, 2011.
- 2012 Election Results
- "Official Results November 4, 2014 General Election". Colorado Secretary of State. Retrieved December 11, 2014.
- "Official Certified Results November 8, 2016 General Election". Colorado Secretary of State. Retrieved January 15, 2017.
Другой контент может иметь иную лицензию. Перед использованием материалов сайта WikiSort.org внимательно изучите правила лицензирования конкретных элементов наполнения сайта.
WikiSort.org - проект по пересортировке и дополнению контента Википедии