world.wikisort.org - USA
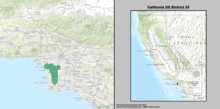
California's 43rd congressional district is a congressional district in the U.S. state of California that is currently represented by Democrat Maxine Waters. The district is centered in the southern part of Los Angeles County, and includes portions of the cities of Los Angeles (including LAX) and Torrance. It includes the entirety of the cities of Hawthorne, Lawndale, Gardena, Inglewood, and Lomita. From 2003 until 2013, the 43rd district was based in San Bernardino County. The Hispanic-majority district encompassed the southwestern part of the county, and included San Bernardino and Rialto.
| California's 43rd congressional district | |||
|---|---|---|---|
Interactive map of district boundaries since 2023 (Used in the 2022 elections) | |||
| Representative |
| ||
| Population (2021) | 728,012 | ||
| Median household income | $74,359[1] | ||
| Ethnicity |
| ||
| Cook PVI | D+29[2] | ||


Competitiveness
In statewide races
| Election results from statewide races | ||
|---|---|---|
| Year | Office | Results |
| 1990 | Governor[3] | Wilson 64.0% - 30.0% |
| 1992 | President[4] | Bush 38.2% - 37.8% |
| Senator[5] | Herschensohn 52.6% - 37.1% | |
| Senator (Special)[5] | Seymour 46.2% - 43.2% | |
| 1994 | Governor[6] | Wilson 63.4% - 31.4% |
| Senator[7] | Huffington 56.2% – 32.8% | |
| 1996 | President[8] | Dole 45.5% - 43.0% |
| 1998 | Governor[9] | Davis 51.2% - 45.6% |
| Senator[10] | Fong 49.2% – 45.9% | |
| 2000 | President[11] | Bush 52.1% - 44.2% |
| Senator[12] | Feinstein 46.8% - 45.6% | |
| 2002 | Governor[13] | Davis 57.4% - 34.6% |
| 2003 | Recall[14][15] | |
| Schwarzenegger 47.3% - 35.2% | ||
| 2004 | President[16] | Kerry 58.1% - 40.7% |
| Senator[17] | Boxer 64.5% - 30.3% | |
| 2006 | Governor[18] | Angelides 48.7% - 45.4% |
| Senator[19] | Feinstein 64.6% - 29.8% | |
| 2008 | President[20] | Obama 68.0% - 30.1% |
| 2010 | Governor[21] | Brown 61.7% - 30.3% |
| Senator[22] | Boxer 60.1% - 32.2% | |
| 2012 | President[23] | Obama 78.0% - 20.0% |
| U.S. Senator[24] | Feinstein 78.3% - 21.7% | |
| 2014 | Governor[25] | Brown 72.6% – 27.4% |
| 2016 | President[26] | Clinton 78.4% - 16.7% |
| Senator[27] | Harris 66.7% - 33.3% | |
| 2018 | Governor[28] | Newsom 78.0% – 22.0% |
| Senator[29] | Feinstein 62.4% – 37.6% | |
| 2020 | President[30] | Biden 76.9% - 20.9% |
| 2021 | Recall[31] | |
Composition
| # | County | Seat | Population |
|---|---|---|---|
| 37 | Los Angeles | Los Angeles | 9,829,544 |
As of the 2020 redistricting, California's 43rd congressional district is located in the South Bay region of Los Angeles County. This district includes Los Angeles International Airport.
Los Angeles County is split between this district, the 36th district, 37th district, 44th district, and the 42nd district. The 43rd and 36th are partitioned by W Florence Ave, Arbor Vitae St, Westchester Parkway, La Tijera Blvd, W 91st St, Cum Laude Ave, W 92nd St, Waterview St, Napoleon St, Vista Del Mar, W Imperial Highway, Aviation Blvd, Del Aire Park, E Sl Segundo Blvd, S Aviation Blvd, Marine Ave, Inglewood Ave, Highway 91, Redondo Beach Blvd, Hawthorne Blvd, and Sepulveda Blvd.
The 43rd, 37th and 42nd are partitioned by E 91st St, McKinley Ave, E 88th Pl, Avalon Blvd, E Manchester Ave, S Normandie Ave, W 94th Pl, S Halldale Ave, W Century Blvd, La Salle Ave/S Denker Ave, W 104th St, S Western Ave, W 108th St, S Gramercy Pl, S Van Ness Ave, W 76th St, 8th Ave, W 79th St, S Victoria Ave, W 74th St, West Blvd, W 64th St, S La Brea Ave, 6231 S La Brea Ave-Flight Ave, W 64th St, 6404 S Springpark Ave-W Fairview Blvd, W Centinela Ave, Ave, S Central Ave, Firestone Blvd-E 90 St, S Central Ave, E 103rd St, Success Ave, E 92nd St, E 91st, Croesus Ave, and E 97th St.
The 43rd and the 44th are partitioned by Alameda St, E 103rd St, Mona Blvd, E 107th Pl, E 108th St, S Alameda St, Highway 105, Mona Blvd, Santa Fe Ave, E Stockton Ave, N Bullis Rd, Palm Ave/E Killen Pl, N Thorson Ave, McMillan St, Waldorf Dr/N Castlegate Ave, S Gibson Ave, Wright Rd, E Rosecrans Ave, Highway 710, Somerset Blvd, Myrrh St, Hunsake Ave, Alondra Blvd, E Greenleaf Blvd, Main Campus Dr, S Susana Rd, Highway 91, Highway 47, Calle Anita, 2605 Homestead Pl-266 W Apras St, 255 W Victoria St-18300 S Wilmington Ave, W Victoria St, Central Ave, Lincoln Memorial Park, 2600 W Billings St-2973 W Caldwell St, Malloy Ave/S Clymar Ave, W Alondra Blvd, S Figueroa St, W 182nd St, Electric St, and S Western Ave.
The 43rd takes in the cities of Hawthorne, Inglewood, Lawndale, Compton, and northeast Torrance, as well as the Los Angeles neighborhood of Watts.
Cities & CDP with 10,000 or more people
List of members representing the district
| Member | Party | Dates | Cong ress(es) |
Electoral history | Counties |
|---|---|---|---|---|---|
| District created January 3, 1973 | |||||
 Victor Veysey |
Republican | January 3, 1973 – January 3, 1975 |
93rd | Redistricted from the 38th district and re-elected in 1972. Retired. |
1973–1975 Imperial, Riverside, Inland San Diego |
 Clair Burgener |
Republican | January 3, 1975 – January 3, 1983 |
94th 95th 96th 97th |
Redistricted from the 42nd district and re-elected in 1974. Re-elected in 1976. Re-elected in 1978. Re-elected in 1980. Retired. |
1975–1983 Imperial, Southwestern Riverside, San Diego |
 Ron Packard |
Republican | January 3, 1983 – January 3, 1993 |
98th 99th 100th 101st 102nd |
Elected as a write-in candidate in 1982. Re-elected in 1984. Re-elected in 1986. Re-elected in 1988. Re-elected in 1990. Redistricted to the 48th district. |
1983–1993 Southern Orange, Northwestern San Diego |
 Ken Calvert |
Republican | January 3, 1993 – January 3, 2003 |
103rd 104th 105th 106th 107th |
Elected in 1992. Re-elected in 1994. Re-elected in 1996. Re-elected in 1998. Re-elected in 2000. Redistricted to the 44th district. |
1993–2003 Western Riverside. |
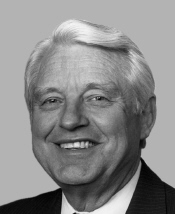
 Joe Baca |
Democratic | January 3, 2003 – January 3, 2013 |
108th 109th 110th 111th 112th |
Redistricted from the 42nd district and re-elected in 2002. Re-elected in 2004. Re-elected in 2006. Re-elected in 2008. Re-elected in 2010. Redistricted to the 35th district and lost. |
2003–2013 San Bernardino (Fontana, Ontario, San Bernardino)  |
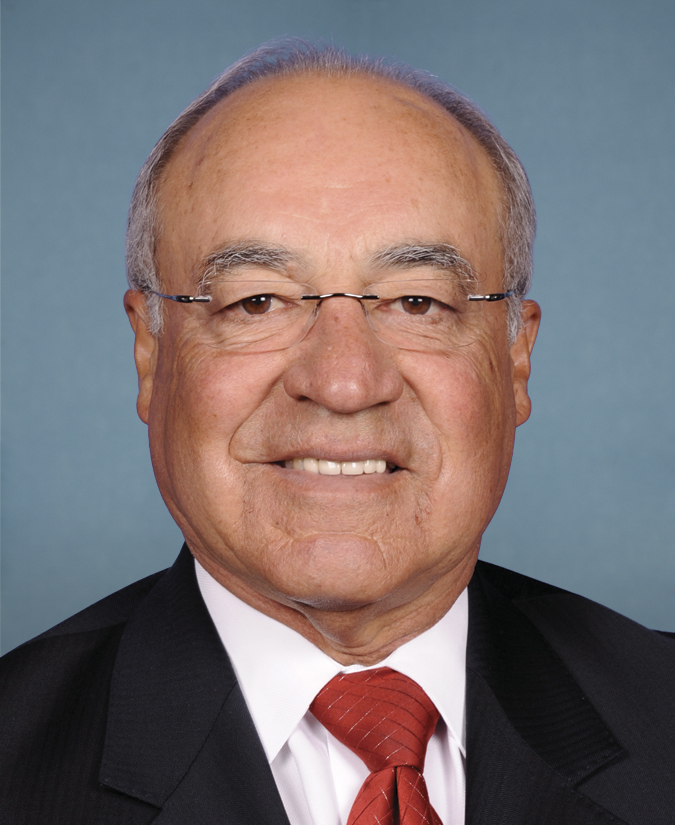
 Maxine Waters |
Democratic | January 3, 2013 – present |
113th 114th 115th 116th 117th |
Redistricted from the 35th district and re-elected in 2012. Re-elected in 2014. Re-elected in 2016. Re-elected in 2018. Re-elected in 2020. Re-elected in 2022. |
2013–Present South Los Angeles (Hawthorne and Inglewood)  |
Election results
|
1972 • 1974 • 1976 • 1978 • 1980 • 1982 • 1984 • 1986 • 1988 • 1990 • 1992 • 1994 • 1996 • 1998 • 2000 • 2002 • 2004 • 2006 • 2008 • 2010 • 2012 • 2014• 2016 • 2018 • 2020 |
1972
| Party | Candidate | Votes | % | ||
|---|---|---|---|---|---|
| Republican | Victor Veysey (Incumbent) | 117,781 | 62.7 | ||
| Democratic | Ernest Z. Robles | 70,129 | 37.3 | ||
| Total votes | 187,910 | 100.0 | |||
| Republican win (new seat) | |||||
1974
| Party | Candidate | Votes | % | |
|---|---|---|---|---|
| Republican | Clair Burgener (Incumbent) | 114,102 | 60.4 | |
| Democratic | Bill Bandes | 74,905 | 39.6 | |
| Total votes | 189,007 | 100.0 | ||
| Republican hold | ||||
1976
| Party | Candidate | Votes | % | |
|---|---|---|---|---|
| Republican | Clair Burgener (Incumbent) | 173,576 | 65.0 | |
| Democratic | Pat Kelly | 93,475 | 35.0 | |
| Total votes | 267,051 | 100.0 | ||
| Republican hold | ||||
1978
| Party | Candidate | Votes | % | |
|---|---|---|---|---|
| Republican | Clair Burgener (Incumbent) | 167,150 | 68.7 | |
| Democratic | Reuben B. Brooks | 76,308 | 31.3 | |
| Total votes | 243,458 | 100.0 | ||
| Republican hold | ||||
1980
| Party | Candidate | Votes | % | |
|---|---|---|---|---|
| Republican | Clair Burgener (Incumbent) | 298,815 | 86.6 | |
| Democratic | Tom Metzger | 46,361 | 13.4 | |
| Total votes | 345,176 | 100.0 | ||
| Republican hold | ||||
1982
| Party | Candidate | Votes | % | |
|---|---|---|---|---|
| Republican | Ron Packard (write-in) | 66,444 | 36.8 | |
| Democratic | Roy Pat Archer | 57,995 | 32.1 | |
| Republican | Johnnie R. Crean | 56,297 | 31.1 | |
| Total votes | 180,736 | 100.0 | ||
| Republican hold | ||||
1984
| Party | Candidate | Votes | % | |
|---|---|---|---|---|
| Republican | Ron Packard (Incumbent) | 165,643 | 74.1 | |
| Democratic | Lois E. Humphreys | 50,996 | 22.8 | |
| Libertarian | Phyllis Avery | 6,878 | 3.1 | |
| Total votes | 223,517 | 100.0 | ||
| Republican hold | ||||
1986
| Party | Candidate | Votes | % | |
|---|---|---|---|---|
| Republican | Ron Packard (Incumbent) | 137,341 | 73.1 | |
| Democratic | Joseph Chirra | 45,078 | 24.0 | |
| Libertarian | Phyllis Avery | 5,370 | 2.9 | |
| Total votes | 187,789 | 100.0 | ||
| Republican hold | ||||
1988
| Party | Candidate | Votes | % | |
|---|---|---|---|---|
| Republican | Ron Packard (Incumbent) | 202,478 | 71.7 | |
| Democratic | Howard Greenbaum | 72,499 | 25.6 | |
| Libertarian | Daniel L. Muhe | 7,552 | 2.7 | |
| Total votes | 282,529 | 100.0 | ||
| Republican hold | ||||
1990
| Party | Candidate | Votes | % | |
|---|---|---|---|---|
| Republican | Ron Packard (Incumbent) | 151,206 | 68.1 | |
| Peace and Freedom | Doug Hansen | 40,212 | 18.1 | |
| Libertarian | Richard L. "Rick" Arnold | 30,720 | 13.8 | |
| Total votes | 222,138 | 100.0 | ||
| Republican hold | ||||
1992
| Party | Candidate | Votes | % | |
|---|---|---|---|---|
| Republican | Ken Calvert | 88,987 | 46.7 | |
| Democratic | Mark A. Takano | 88,468 | 46.4 | |
| American Independent | Gary Odom | 6,095 | 3.2 | |
| Libertarian | Gene L. Berkman | 4,989 | 2.6 | |
| Independent | John Schwab (write-in) | 2,100 | 1.1 | |
| Invalid or blank votes | 13,210 | 6.5 | ||
| Total votes | 203,849 | 100.0 | ||
| Republican hold | ||||
1994
| Party | Candidate | Votes | % | |
|---|---|---|---|---|
| Republican | Ken Calvert (Incumbent) | 84,500 | 54.7 | |
| Democratic | Mark A. Takano | 59,342 | 38.4 | |
| Libertarian | Gene L. Berkman | 9,636 | 6.3 | |
| Independent | John Schwab (write-in) | 767 | 0.5 | |
| Independent | Velma Hickey (write-in) | 141 | 0.1 | |
| Invalid or blank votes | 6,421 | 4.0 | ||
| Total votes | 160,807 | 100.0 | ||
| Republican hold | ||||
1996
| Party | Candidate | Votes | % | |
|---|---|---|---|---|
| Republican | Ken Calvert (Incumbent) | 97,247 | 54.7 | |
| Democratic | Guy Kimborough | 67,422 | 37.9 | |
| Natural Law | Annie Wallack | 6,576 | 3.7 | |
| Peace and Freedom | Kevin Akin | 3,309 | 1.9 | |
| Libertarian | Gene Berkman | 3,086 | 1.7 | |
| Independent | Colleen Cummings (write-in) | 84 | 0.1 | |
| Invalid or blank votes | 6,571 | 3.6 | ||
| Total votes | 184,295 | 100.0 | ||
| Republican hold | ||||
1998
| Party | Candidate | Votes | % | |
|---|---|---|---|---|
| Republican | Ken Calvert (Incumbent) | 83,012 | 55.7 | |
| Democratic | Mike Rayburn | 56,373 | 37.8 | |
| Green | Phill Courtney | 5,508 | 3.7 | |
| Natural Law | Annie Wallack | 4,178 | 2.8 | |
| Invalid or blank votes | 9,064 | 5.7 | ||
| Total votes | 158,135 | 100.0 | ||
| Republican hold | ||||
2000
| Party | Candidate | Votes | % | |
|---|---|---|---|---|
| Republican | Ken Calvert (Incumbent) | 140,201 | 73.7 | |
| Libertarian | Bill Reed | 29,755 | 15.6 | |
| Natural Law | Nat Adam | 20,376 | 10.7 | |
| Invalid or blank votes | 0 | 0.0 | ||
| Total votes | 190,332 | 100.0 | ||
| Republican hold | ||||
2002
| Party | Candidate | Votes | % | |
|---|---|---|---|---|
| Democratic | Joe Baca (Incumbent) | 45,374 | 66.4 | |
| Republican | Wendy C. Neighbor | 20,821 | 30.5 | |
| Libertarian | Ethel M. Mohler | 2,145 | 3.1 | |
| Invalid or blank votes | 5,273 | 7.2 | ||
| Total votes | 73,613 | 100.0 | ||
| Democratic hold | ||||
2004
| Party | Candidate | Votes | % | |
|---|---|---|---|---|
| Democratic | Joe Baca (Incumbent) | 86,830 | 66.4 | |
| Republican | Ed Laning | 44,004 | 33.6 | |
| Independent | Barry J. Patts (write-in) | 0 | 0.0 | |
| Total votes | 130,834 | 100.0 | ||
| Democratic hold | ||||
2006
| Party | Candidate | Votes | % | |
|---|---|---|---|---|
| Democratic | Joe Baca (Incumbent) | 52,791 | 64.5 | |
| Republican | Scott Folkens | 29,069 | 35.5 | |
| Total votes | 81,860 | 100.0 | ||
| Democratic hold | ||||
2008
| Party | Candidate | Votes | % | |
|---|---|---|---|---|
| Democratic | Joe Baca (Incumbent) | 108,259 | 69.1 | |
| Republican | John Roberts | 48,312 | 30.9 | |
| Total votes | 156,571 | 100.0 | ||
| Turnout | 63.4 | |||
| Democratic hold | ||||
2010
| Party | Candidate | Votes | % | |
|---|---|---|---|---|
| Democratic | Joe Baca (Incumbent) | 70,026 | 65.5 | |
| Republican | Scott Folkens | 36,890 | 34.5 | |
| Total votes | 106,916 | 100.0 | ||
| Democratic hold | ||||
2012
| Party | Candidate | Votes | % | |
|---|---|---|---|---|
| Democratic | Maxine Waters (Incumbent) | 143,123 | 71.2 | |
| Democratic | Bob Flores | 57,771 | 28.8 | |
| Total votes | 200,894 | 100.0 | ||
| Democratic hold | ||||
2014
| Party | Candidate | Votes | % | |
|---|---|---|---|---|
| Democratic | Maxine Waters (Incumbent) | 69,681 | 71.0 | |
| Republican | John Wood, Jr. | 28,521 | 29.0 | |
| Total votes | 98,202 | 100.0 | ||
| Democratic hold | ||||
2016
| Party | Candidate | Votes | % | |
|---|---|---|---|---|
| Democratic | Maxine Waters (Incumbent) | 167,017 | 76.1 | |
| Republican | Omar Navarro | 52,499 | 23.9 | |
| Total votes | 219,516 | 100.0 | ||
| Democratic hold | ||||
2018
| Party | Candidate | Votes | % | |
|---|---|---|---|---|
| Democratic | Maxine Waters (Incumbent) | 152,272 | 77.7 | |
| Republican | Omar Navarro | 43,780 | 22.3 | |
| Total votes | 196,052 | 100.0 | ||
| Democratic hold | ||||
2020
| Party | Candidate | Votes | % | |
|---|---|---|---|---|
| Democratic | Maxine Waters (incumbent) | 199,210 | 71.7 | |
| Republican | Joe E. Collins III | 78,688 | 28.3 | |
| Total votes | 277,898 | 100.0 | ||
| Democratic hold | ||||
Historical district boundaries
From 2003 through 2013, the district consisted of many of San Bernardino's central suburbs, including San Bernardino, Ontario and Fontana. Due to redistricting after the 2010 United States Census, the district has moved south west into South Los Angeles and now includes Hawthorne and Inglewood.
See also
- List of United States congressional districts
References
- Center for New Media & Promotion (CNMP), US Census Bureau. "My Congressional District". www.census.gov.
- "Partisan Voting Index – Districts of the 115th Congress" (PDF). The Cook Political Report. April 7, 2017. Retrieved April 7, 2017.
- Statement of Vote (1990 Governor)
- Statement of Vote (1992 President)
- Statement of Vote (1992 Senate)
- Statement of Vote (1994 Governor)
- Statement of Vote (1994 Senate)
- Statement of Vote (1996 President)
- "Statement of Vote (1998 Governor)" (PDF). Archived from the original (PDF) on September 29, 2011.
- "Statement of Vote (1998 Senate)" (PDF). Archived from the original (PDF) on September 29, 2011.
- Statement of Vote (2000 President)
- Statement of Vote (2000 Senator)
- Statement of Vote (2002 Governor)
- Statement of Vote (2003 Recall Question)
- Statement of Vote (2003 Governor)
- Statement of Vote (2004 President)
- Statement of Vote (2004 Senator)
- Statement of Vote (2006 Governor)
- Statement of Vote (2006 Senator)
- Statement of Vote (2008 President)
- Statement of Vote (2010 Governor)
- Statement of Vote (2010 Senator)
- Statement of Vote (2012 President)
- Statement of Vote (2012 Senator)
- Statement of Vote (2014 Governor)
- Statement of Vote (2016 President)
- Statement of Vote (2016 Senate)
- Statement of Vote (2018 Governor)
- Statement of Vote (2018 Senator)
- "Daily Kos Elections' presidential results by congressional district for 2020, 2016, and 2012".
- "Our Campaigns - CA Governor - Recall Question Race - Sep 14, 2021".
- "1972 election results" (PDF).
- "1974 election results" (PDF).
- "1976 election results" (PDF).
- "1978 election results" (PDF).
- "1980 election results" (PDF).
- "1982 election results" (PDF).
- "1984 election results" (PDF).
- "1986 election results" (PDF).
- "1988 election results" (PDF).
- "1990 election results" (PDF).
- "1992 election results" (PDF).
- "1994 election results" (PDF).
- "1996 election results" (PDF).
- "1998 election results" (PDF).
- "2000 election results" (PDF).
- 2002 election results
- 2004 election results
- 2006 election results
- 2008 election results
- 2010 election results
- 2012 election results
- 2014 election results
- 2016 election results
- 2018 election results
External links
- The new District 43— California's GovTrack.us: Map of current 43rd congressional district (Westside, Los Angeles County)
- California Voter Foundation map of former 43rd congressional district (San Bernardino County) — (pre-2013).
- RAND.org: California Election Returns for pre-2013 43rd congressional district (San Bernardino County)
Другой контент может иметь иную лицензию. Перед использованием материалов сайта WikiSort.org внимательно изучите правила лицензирования конкретных элементов наполнения сайта.
WikiSort.org - проект по пересортировке и дополнению контента Википедии