world.wikisort.org - United_Kingdom
Hertford and Stevenage was a parliamentary constituency in Hertfordshire, which returned one Member of Parliament (MP) to the House of Commons of the Parliament of the United Kingdom from February 1974 until it was abolished for the 1983 general election.
| Hertford and Stevenage | |
|---|---|
| Former County constituency for the House of Commons | |
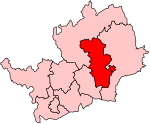 Hertford and Stevenage in Hertfordshire, showing boundaries used from 1974-1983 | |
| February 1974–1983 | |
| Number of members | one |
| Replaced by | Stevenage, Hertford & Stortford and Broxbourne[1] |
| Created from | Hertford, Hitchin and Hertfordshire East |
Boundaries
The Municipal Borough of Hertford, the Urban Districts of Stevenage and Ware, and the Rural District of Hertford.
Hertford and its rural district had previously been in the Hertford constituency, Stevenage in Hitchin and Ware in Hertfordshire East. After being used for only three general elections, a further round of boundary changes in 1983 saw Hertford and Stevenage abolished, with Hertford and Ware joining Bishop's Stortford in Hertford and Stortford while the remainder of the seat formed the basis of the new Stevenage constituency.
Members of Parliament
| Election | Member | Party | |
|---|---|---|---|
| Feb 1974 | Shirley Williams | Labour | |
| 1979 | Bowen Wells | Conservative | |
| 1983 | constituency abolished | ||
Elections
| Party | Candidate | Votes | % | ±% | |
|---|---|---|---|---|---|
| Conservative | Bowen Wells | 31,739 | 45.1 | +12.4 | |
| Labour | Shirley Williams | 30,443 | 43.2 | −3.9 | |
| Liberal | B Rigby | 7,660 | 10.9 | −7.3 | |
| National Front | J Pell | 581 | 0.8 | −1.2 | |
| Majority | 1,296 | 1.9 | N/A | ||
| Turnout | 70,423 | 80.4 | +4.1 | ||
| Conservative gain from Labour | Swing | +8.1 | |||
| Party | Candidate | Votes | % | ±% | |
|---|---|---|---|---|---|
| Labour | Shirley Williams | 29,548 | 47.13 | ||
| Conservative | Vivian Bendall | 20,502 | 32.70 | ||
| Liberal | TN Willis | 11,419 | 18.21 | ||
| National Front | K Taylor | 1,232 | 1.96 | New | |
| Majority | 9,046 | 14.43 | |||
| Turnout | 62,701 | 76.26 | |||
| Labour hold | Swing | ||||
| Party | Candidate | Votes | % | ±% | |
|---|---|---|---|---|---|
| Labour | Shirley Williams | 30,343 | 44.65 | ||
| Conservative | Vivian Bendall | 22,167 | 32.62 | ||
| Liberal | TN Willis | 15,444 | 22.73 | ||
| Majority | 8,176 | 12.03 | |||
| Turnout | 67,954 | 83.58 | |||
| Labour win (new seat) | |||||
References
- "'Hertford and Stevenage', Feb 1974 - May 1983". ElectionWeb Project. Cognitive Computing Limited. Retrieved 22 March 2016.[permanent dead link]
- Robert Waller, The Almanac of British Politics (1st edition, London: Croom Helm, 1983)
- Frederic A Youngs, jr, Guide to the Local Administrative Units of England, Vol I (London: Royal Historical Society, 1979)
- Leigh Rayment's Historical List of MPs – Constituencies beginning with "H" (part 3)
Другой контент может иметь иную лицензию. Перед использованием материалов сайта WikiSort.org внимательно изучите правила лицензирования конкретных элементов наполнения сайта.
WikiSort.org - проект по пересортировке и дополнению контента Википедии