world.wikisort.org - Mexico
Tecomán is a city and seat of the municipality of Tecomán in the Mexican state of Colima, about 50 km south of the city of Colima. In the 2005 census the city had a population of 112,726 people. It is the third-largest community in the state of Colima. The municipality has an area of 834.77 km² (322.31 sq mi). Near the coast on Federal Highway 200, it is situated a rich agricultural industries region and is known as the "lime capital of the world".[1] Due to its soaring homicide rate, Tecomán became the deadliest municipality in Mexico in 2016.[2]
Cocolan
Tecoman City | |
|---|---|
City | |
 Cathedral of Santiago Apostol | |
 Coat of arms | |
| Motto(s): Lime Capital of the World | |
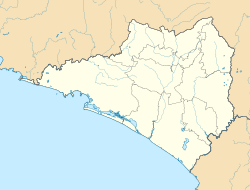
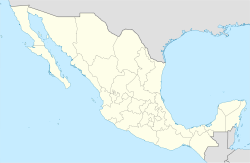
 Cocolan Location in Mexico  Cocolan Cocolan (Mexico) | |
| Coordinates: 18°54′32″N 103°52′29″W | |
| Country | |
| State | Colima |
| Municipality | Tecomán |
| Population (2010) | |
| • City | 112,726 |
| • Metro | 141,421 |
| Time zone | UTC-6 (Central Standard Time) |
| • Summer (DST) | UTC-5 (Central Daylight Time) |
Economy
The main economic activities of the area are:
- Agriculture: Limes, coconuts, tamarind, mango and bananas.
- Livestock: Cattle, pigs, sheep, goats and apiculture.
- Industrial: Citrus and coconut agroindustry
- Mining: Dolomite, limestone and silver
Climate
| Climate data for Tecomán | |||||||||||||
|---|---|---|---|---|---|---|---|---|---|---|---|---|---|
| Month | Jan | Feb | Mar | Apr | May | Jun | Jul | Aug | Sep | Oct | Nov | Dec | Year |
| Record high °C (°F) | 37.5 (99.5) |
38.0 (100.4) |
38.0 (100.4) |
39.0 (102.2) |
41.0 (105.8) |
38.0 (100.4) |
41.0 (105.8) |
40.0 (104.0) |
39.5 (103.1) |
41.0 (105.8) |
40.0 (104.0) |
38.0 (100.4) |
41.0 (105.8) |
| Average high °C (°F) | 31.9 (89.4) |
31.9 (89.4) |
32.0 (89.6) |
32.3 (90.1) |
33.1 (91.6) |
33.7 (92.7) |
33.9 (93.0) |
33.8 (92.8) |
33.4 (92.1) |
33.8 (92.8) |
33.5 (92.3) |
32.8 (91.0) |
33.0 (91.4) |
| Daily mean °C (°F) | 23.9 (75.0) |
23.7 (74.7) |
23.9 (75.0) |
24.6 (76.3) |
26.4 (79.5) |
28.3 (82.9) |
28.5 (83.3) |
28.4 (83.1) |
28.1 (82.6) |
28.1 (82.6) |
26.9 (80.4) |
25.3 (77.5) |
26.3 (79.3) |
| Average low °C (°F) | 15.9 (60.6) |
15.4 (59.7) |
15.9 (60.6) |
16.9 (62.4) |
19.6 (67.3) |
22.8 (73.0) |
23.1 (73.6) |
23.0 (73.4) |
22.8 (73.0) |
22.3 (72.1) |
20.2 (68.4) |
17.8 (64.0) |
19.6 (67.3) |
| Record low °C (°F) | 9.0 (48.2) |
1.5 (34.7) |
9.5 (49.1) |
8.5 (47.3) |
11.0 (51.8) |
16.0 (60.8) |
16.0 (60.8) |
18.0 (64.4) |
18.5 (65.3) |
14.0 (57.2) |
10.0 (50.0) |
1.6 (34.9) |
1.5 (34.7) |
| Average precipitation mm (inches) | 32.6 (1.28) |
2.0 (0.08) |
0.6 (0.02) |
0.2 (0.01) |
17.6 (0.69) |
107.8 (4.24) |
154.9 (6.10) |
181.5 (7.15) |
181.4 (7.14) |
80.8 (3.18) |
38.5 (1.52) |
12.7 (0.50) |
810.6 (31.91) |
| Average precipitation days (≥ 0.1 mm) | 1.3 | 0.3 | 0.2 | 0.1 | 0.8 | 7.5 | 11.2 | 11.9 | 10.9 | 4.9 | 1.6 | 1.0 | 51.7 |
| Source: Servicio Meteorologico Nacional[3] | |||||||||||||
Tourism
Nearby Beaches & recreational areas:
- Playa El Real. 10 km. south of Tecomán. Open sea, good surfing.
- Playa Boca de Pascuales. 12 km. from Tecomán. Surfing beach for the experienced. Enramadas serving fresh seafood.
- Playa de Tecuanillo. Narrow, fine-sanded, not-too-steep beach
- Laguna de Amela. Deep lagoon surrounded by lush vegetation.
- Laguna de Alcuzahue. Lagoon 8 km from Tecomán. Visit the Crocodile reserve.
- Playa Paraiso. Open sea, Ramadas serving delicious freshly cooked food with Coconut drinks. Usually a calm beach except during rainy season.
- Boca De Apiza.
References
- Nguyen, C. Thi (September 23, 2008). "Mariscos from the Lime Capital of the World". chowhound.com. Chowhound. Retrieved August 4, 2017.
- Ahmed, Azam (August 4, 2017). "Mexico's Deadliest Town. Mexico's Deadliest Year". New York Times. p. A1. Retrieved August 4, 2017.
- NORMALES CLIMATOLÓGICAS 1971-2000 Archived 2013-07-16 at the Wayback Machine, National Meteorological Service of Mexico. Retrieved August 7, 2012 .
External links
- Ayuntamiento de Tecomán Official website
- Tecoman Info
- https://web.archive.org/web/20080708062104/http://www.tecomense.com.mx/
- Eco-volunteering projects with sea turtles.
- Link to tables of population data from Census of 2005 INEGI: Instituto Nacional de Estadística, Geografía e Informática
- Colima Enciclopedia de los Municipios de México
Текст в блоке "Читать" взят с сайта "Википедия" и доступен по лицензии Creative Commons Attribution-ShareAlike; в отдельных случаях могут действовать дополнительные условия.
Другой контент может иметь иную лицензию. Перед использованием материалов сайта WikiSort.org внимательно изучите правила лицензирования конкретных элементов наполнения сайта.
Другой контент может иметь иную лицензию. Перед использованием материалов сайта WikiSort.org внимательно изучите правила лицензирования конкретных элементов наполнения сайта.
2019-2025
WikiSort.org - проект по пересортировке и дополнению контента Википедии
WikiSort.org - проект по пересортировке и дополнению контента Википедии
