world.wikisort.org - India
Dharupur is a village in Gauriganj block of Amethi district, Uttar Pradesh, India.[2] As of 2011, it has a population of 1,112 people, in 169 households.[2] It has one primary school and no healthcare facilities and does not host a permanent market or weekly haat.[2] It belongs to the nyaya panchayat of Semuai.[3]
Dharupur
Dhārupur | |
|---|---|
Village | |
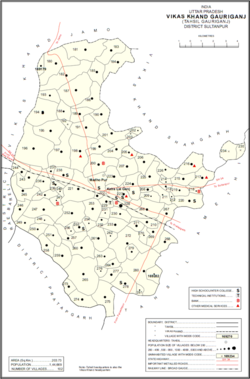 Map showing Dharupur (#246) in Gauriganj CD block | |
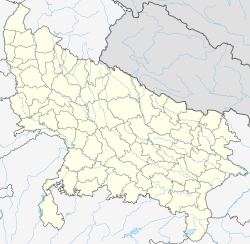 Dharupur Location in Uttar Pradesh, India | |
| Coordinates: 26.19798°N 81.61986°E[1] | |
| Country | |
| State | Uttar Pradesh |
| Division | Faizabad division |
| District | Amethi |
| Area | |
| • Total | 1.17 km2 (0.45 sq mi) |
| Population (2011)[2] | |
| • Total | 1,112 |
| • Density | 950/km2 (2,500/sq mi) |
| Languages | |
| • Official | Hindi, Urdu |
| Time zone | UTC+5:30 (IST) |
The 1951 census recorded Dharupur as comprising 4 hamlets, with a total population of 427 people (202 male and 225 female), in 100 households and 96 physical houses.[4] The area of the village was given as 374 acres.[4] No residents were literate.[4] The village was listed as belonging to the pargana of Amethi and the thana of Gauriganj.[4]
The 1961 census recorded Dharupur (as "Bharupur") as comprising 4 hamlets, with a total population of 502 people (238 male and 264 female), in 106 households and 102 physical houses.[5] The area of the village was given as 374 acres.[5]
The 1981 census recorded Dharupur as having a population of 632 people, in 127 households, and having an area of 150.55 hectares.[6] The main staple foods were listed as wheat and rice.[6]
The 1991 census recorded Dharupur (as "Dharu Pur") as having a total population of 736 people (370 male and 366 female), in 133 households and 131 physical houses.[3] The area of the village was listed as 151.00 hectares.[3] Members of the 0-6 age group numbered 147, or 20% of the total; this group was 46% male (68) and 54% female (79).[3] Members of scheduled castes numbered 208, or 28% of the village's total population, while no members of scheduled tribes were recorded.[3] The literacy rate of the village was 15% (81 men and 5 women, counting only people age 7 and up).[3] 371 people were classified as main workers (211 men and 160 women), while 0 people were classified as marginal workers; the remaining 365 residents were non-workers.[3] The breakdown of main workers by employment category was as follows: 7 cultivators (i.e. people who owned or leased their own land); 359 agricultural labourers (i.e. people who worked someone else's land in return for payment); 0 workers in livestock, forestry, fishing, hunting, plantations, orchards, etc.; 0 in mining and quarrying; 2 household industry workers; 3 workers employed in other manufacturing, processing, service, and repair roles; 0 construction workers; 0 employed in trade and commerce; 0 employed in transport, storage, and communications; and 0 in other services.[3]
References
- "Geonames Search". Do a radial search using these coordinates here.
- "Census of India 2011: Uttar Pradesh District Census Handbook - Sultanpur, Part A (Village and Town Directory)" (PDF). Census 2011 India. pp. 181–98. Retrieved 13 November 2021.
- Census 1991 Series-25 Uttar Pradesh Part-XII B Village & Townwise Primary Census Abstract District Census Handbook District Sultanpur (PDF). 1992. pp. xxiv–xxviii, 114–5. Retrieved 13 November 2021.
- Census of India, 1951: District Census Handbook Uttar Pradesh (49 - Sultanpur District) (PDF). Allahabad. 1955. pp. 96–7. Retrieved 13 November 2021.
- Census 1961: District Census Handbook, Uttar Pradesh (44 - Sultanpur District) (PDF). Lucknow. 1965. pp. xl–xli. Retrieved 13 November 2021.
- Census 1981 Uttar Pradesh: District Census Handbook Part XIII-A: Village & Town Directory, District Sultanpur (PDF). 1982. pp. 90–1. Retrieved 13 November 2021.
Другой контент может иметь иную лицензию. Перед использованием материалов сайта WikiSort.org внимательно изучите правила лицензирования конкретных элементов наполнения сайта.
WikiSort.org - проект по пересортировке и дополнению контента Википедии