world.wikisort.org - Colombia
La Gabarra Is a corregimiento located in a rural area of the municipality of Tibú, department of Norte de Santander, Colombia.
La Gabarra | |
|---|---|
 La Gabarra Ubicación Norte de Santander Department and Colombia 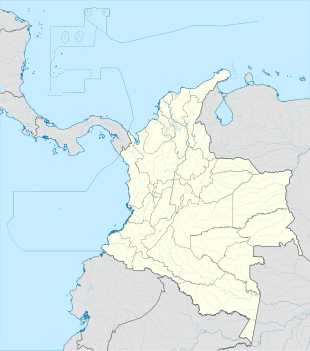 La Gabarra La Gabarra (Colombia) | |
| Coordinates: 9°0′0.5″N 72°53′49.4″W | |
| País | |
| Departamento | Norte de Santander |
| Municipio | Tibú |
| Government | |
| • Type | Corregimiento |
| Elevation | 144 ft (44 m) |
| Population (2018) | |
| • Total | 4,986 [1] |
| Time zone | UTC-5 (Colombia Standard Time) |
Climate
La Gabarra has a tropical rainforest climate (Af) with heavy rainfall from January to March and very heavy rainfall in the remaining months with extremely heavy rainfall in October and November.
| Climate data for La Gabarra | |||||||||||||
|---|---|---|---|---|---|---|---|---|---|---|---|---|---|
| Month | Jan | Feb | Mar | Apr | May | Jun | Jul | Aug | Sep | Oct | Nov | Dec | Year |
| Average high °C (°F) | 32.2 (90.0) |
32.5 (90.5) |
32.8 (91.0) |
32.3 (90.1) |
32.3 (90.1) |
32.2 (90.0) |
32.6 (90.7) |
32.8 (91.0) |
32.3 (90.1) |
31.6 (88.9) |
31.4 (88.5) |
31.7 (89.1) |
32.2 (90.0) |
| Daily mean °C (°F) | 26.8 (80.2) |
27.0 (80.6) |
27.7 (81.9) |
27.8 (82.0) |
28.0 (82.4) |
27.7 (81.9) |
27.8 (82.0) |
28.0 (82.4) |
27.8 (82.0) |
27.5 (81.5) |
27.2 (81.0) |
26.9 (80.4) |
27.5 (81.5) |
| Average low °C (°F) | 21.4 (70.5) |
21.6 (70.9) |
22.7 (72.9) |
23.3 (73.9) |
23.7 (74.7) |
23.3 (73.9) |
23.0 (73.4) |
23.2 (73.8) |
23.3 (73.9) |
23.4 (74.1) |
23.0 (73.4) |
22.2 (72.0) |
22.8 (73.1) |
| Average rainfall mm (inches) | 139.4 (5.49) |
130.6 (5.14) |
178.3 (7.02) |
473.1 (18.63) |
581.2 (22.88) |
424.9 (16.73) |
399.5 (15.73) |
500.8 (19.72) |
545.9 (21.49) |
764.9 (30.11) |
672.8 (26.49) |
373.5 (14.70) |
5,184.9 (204.13) |
| Source: IDEAM (as Puerto Barco)[2] | |||||||||||||
References
- "La Gabarra (Tibú, Norte de Santander, Colombia) - Population Statistics, Charts, Map, Location, Weather and Web Information". www.citypopulation.de.
- "Data". www.ideam.gov.co. Retrieved 2021-01-22.
This Colombian location article is a stub. You can help Wikipedia by expanding it. |
На других языках
- [en] La Gabarra
[es] La Gabarra
La Gabarra es un corregimiento del municipio de Tibú, en el Departamento de Norte de Santander, Colombia. Es considerado el corregimiento más poblado e importante del municipio. Está situada a orillas del Río Catatumbo y cerca de la frontera con Venezuela. Tiene aproximadamente 13.000 habitantes según el DANE.Текст в блоке "Читать" взят с сайта "Википедия" и доступен по лицензии Creative Commons Attribution-ShareAlike; в отдельных случаях могут действовать дополнительные условия.
Другой контент может иметь иную лицензию. Перед использованием материалов сайта WikiSort.org внимательно изучите правила лицензирования конкретных элементов наполнения сайта.
Другой контент может иметь иную лицензию. Перед использованием материалов сайта WikiSort.org внимательно изучите правила лицензирования конкретных элементов наполнения сайта.
2019-2026
WikiSort.org - проект по пересортировке и дополнению контента Википедии
WikiSort.org - проект по пересортировке и дополнению контента Википедии