world.wikisort.org - Canada
St. John's South—Mount Pearl (French: St. John's-Sud—Mount Pearl; formerly St. John's South) is a federal electoral district in Newfoundland and Labrador, Canada, that has been represented in the House of Commons of Canada since 2004.
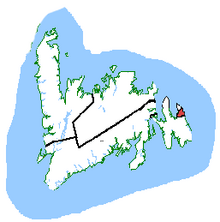 St. John's South—Mount Pearl in relation to other Newfoundland and Labrador ridings | |||
| Federal electoral district | |||
| Legislature | House of Commons | ||
| MP |
Liberal | ||
| District created | 2003 | ||
| First contested | 2004 | ||
| Last contested | 2021 | ||
| District webpage | profile, map | ||
| Demographics | |||
| Population (2016)[1] | 81,979 | ||
| Electors (2019) | 67,170 | ||
| Area (km²)[1] | 503 | ||
| Pop. density (per km²) | 163 | ||
| Census division(s) | Division 1 | ||
| Census subdivision(s) | St. John's, Mount Pearl, Bay Bulls, Petty Harbour-Maddox Cove, Witless Bay | ||
Under the proposed 2022 Canadian federal electoral redistribution, this riding would be renamed Cape Spear.
Demographics
Ethnic groups: 99.2% White
Languages: 98.7% English
Religions: 52.8% Catholic, 42.4% Protestant, 3.6% no affiliation
Average income: $25 379
Geography
The district includes the south end of the City of St. John's, the City of Mount Pearl, and the Town of Petty Harbour-Maddox Cove.
The neighbouring ridings are Avalon and St. John's East.
According to Elections Canada, the geographic boundaries of this riding for the 39th General Election are:
- "All that area consisting of:
- (a) that part of the City of St. John's lying southeasterly of the southeasterly limits of the towns of Conception Bay South and Paradise, and southeasterly of a line described as follows: commencing at the intersection of the westerly limit of the City of St. John's with Kenmount Road immediately north of the northwesterly limit of the City of Mount Pearl; thence northeasterly and easterly along said road, Freshwater Road and Longs Hill to Gower Street; thence northeasterly along said street to Kings Bridge Road; thence northerly along said road to Rennie's River; thence generally easterly along said river, Quidi Vidi Lake and the channel known locally as Quidi Vidi Gut to Quidi Vidi Harbour;
- (b) the City of Mount Pearl; and
- (c) the Town of Petty Harbour-Maddox Cove. Including all islands adjacent to the shoreline of the above-described area."
See also Elections Canada's map of the riding (.PDF).
History
The electoral district was created in 2003: 95.1% of the population of the riding came from St. John's West, and 4.9% from St. John's East ridings. As of the 2012 electoral redistribution, 5% of this riding would be moved to St. John's East, and it would gain 3% from Avalon.
The 2012 federal electoral boundaries redistribution concluded that the electoral boundaries of St. John's South—Mount Pearl should be adjusted, and a modified electoral district of the same name will be contested in future elections.[2] The redefined St. John's South—Mount Pearl had its boundaries legally defined in the 2013 representation order which came into effect upon the call of the 42nd Canadian federal election, scheduled for 19 October 2015.[3]
Members of Parliament
This riding has elected the following Members of Parliament:
| Parliament | Years | Member | Party | |
|---|---|---|---|---|
| St. John's South Riding created from St. John's West and St. John's East |
||||
| 38th | 2004–2006 | Loyola Hearn | Conservative | |
| St. John's South—Mount Pearl | ||||
| 39th | 2006–2008 | Loyola Hearn | Conservative | |
| 40th | 2008–2011 | Siobhán Coady | Liberal | |
| 41st | 2011–2015 | Ryan Cleary | New Democratic | |
| 42nd | 2015–2019 | Seamus O'Regan | Liberal | |
| 43rd | 2019–2021 | |||
| 44th | 2021–present | |||
Election results
St. John's South—Mount Pearl
2021 general election
| 2021 Canadian federal election | ||||||||
|---|---|---|---|---|---|---|---|---|
| Party | Candidate | Votes | % | ±% | Expenditures | |||
| Liberal | Seamus O'Regan | 19,478 | 56.17 | +5.07 | ||||
| New Democratic | Ray Critch | 8,113 | 23.40 | -3.38 | ||||
| Conservative | Steve Hodder | 6,447 | 18.59 | -0.50 | ||||
| People's | Georgia Faith Stewart | 638 | 1.84 | – | ||||
| Total valid votes | 34,676 | 98.82 | +0.25 | |||||
| Total rejected ballots | 414 | 1.18 | -0.25 | |||||
| Turnout | 35,090 | |||||||
| Registered voters | 66,201 | |||||||
| Liberal hold | Swing | +4.21 | ||||||
| Source: Elections Canada[4] | ||||||||
2019 general election
| 2019 Canadian federal election | ||||||||
|---|---|---|---|---|---|---|---|---|
| Party | Candidate | Votes | % | ±% | Expenditures | |||
| Liberal | Seamus O'Regan | 20,793 | 51.13 | −6.73 | $58,125.56 | |||
| New Democratic | Anne Marie Anonsen | 10,890 | 26.78 | −9.98 | $25,130.37 | |||
| Conservative | Terry Martin | 7,767 | 19.10 | +14.53 | $56,978.54 | |||
| Green | Alexandra Hayward | 740 | 1.82 | +1.01 | $0.00 | |||
| People's | Benjamin Ruckpaul | 335 | 0.82 | – | none listed | |||
| Christian Heritage | David Jones | 141 | 0.35 | – | none listed | |||
| Total valid votes/expense limit | 40,666 | 98.57 | $100,487.58 | |||||
| Total rejected ballots | 592 | 1.43 | +1.13 | |||||
| Turnout | 41,258 | 61.42 | −5.71 | |||||
| Eligible voters | 67,170 | |||||||
| Liberal hold | Swing | +1.62 | ||||||
| Source: Elections Canada[5] | ||||||||
2015 general election
| 2015 Canadian federal election | ||||||||
|---|---|---|---|---|---|---|---|---|
| Party | Candidate | Votes | % | ±% | Expenditures | |||
| Liberal | Seamus O'Regan | 25,992 | 57.86 | +29.16 | $124,533.70 | |||
| New Democratic | Ryan Cleary | 16,467 | 36.76 | –9.58 | $98,225.69 | |||
| Conservative | Marek Krol | 2,047 | 4.57 | –19.64 | $24,331.40 | |||
| Green | Jackson McLean | 365 | 0.81 | +0.09 | – | |||
| Total valid votes/expense limit | 44,801 | 100.00 | $201,093.98 | |||||
| Total rejected ballots | 133 | 0.30 | ||||||
| Turnout | 44,934 | 67.13 | ||||||
| Eligible voters | 66,936 | |||||||
| Liberal gain from New Democratic | Swing | +19.37 | ||||||
| Source: Elections Canada[6][7] | ||||||||
| 2011 federal election redistributed results[8] | |||
|---|---|---|---|
| Party | Vote | % | |
| New Democratic | 17,925 | 46.34 | |
| Liberal | 11,104 | 28.70 | |
| Conservative | 9,366 | 24.21 | |
| Green | 280 | 0.72 | |
| Others | 9 | 0.02 | |
2011 general election
| 2011 Canadian federal election | ||||||||
|---|---|---|---|---|---|---|---|---|
| Party | Candidate | Votes | % | ±% | Expenditures | |||
| New Democratic | Ryan Cleary | 18,681 | 47.92 | +7.36 | $67,211.17 | |||
| Liberal | Siobhán Coady | 11,130 | 28.55 | -14.77 | $81,760.42 | |||
| Conservative | Loyola Sullivan | 8,883 | 22.79 | +10.24 | $78,347.37 | |||
| Green | Rick Austin | 291 | 0.75 | -1.11 | none listed | |||
| Total valid votes/expense limit | 38,985 | 100.0 | – | $82,628.65 | ||||
| Total rejected, declined and unmarked ballots | 108 | 0.28 | +0.01 | |||||
| Turnout | 39,093 | 58.97 | +7.02 | |||||
| Eligible voters | 66,294 | |||||||
| New Democratic gain from Liberal | Swing | +11.06 | ||||||
| Sources:[9][10] | ||||||||
2008 general election
| 2008 Canadian federal election | ||||||||
|---|---|---|---|---|---|---|---|---|
| Party | Candidate | Votes | % | ±% | Expenditures | |||
| Liberal | Siobhán Coady | 14,920 | 43.32 | +10.32 | $63,155.64 | |||
| New Democratic | Ryan Cleary | 13,971 | 40.56 | +18.87 | $18,947.03 | |||
| Conservative | Merv Wiseman | 4,324 | 12.55 | -32.13 | $63,115.88 | |||
| Green | Ted Warren | 643 | 1.86 | +1.23 | $172.03 | |||
| Newfoundland and Labrador First | Greg Byrne | 402 | 1.16 | – | $2,908.17 | |||
| Independent | Terry Christopher Butler | 179 | 0.51 | – | none listed | |||
| Total valid votes/expense limit | 34,439 | 100.0 | – | $80,167 | ||||
| Total rejected, declined and unmarked ballots | 92 | 0.27 | -0.06 | |||||
| Turnout | 34,531 | 51.95 | ||||||
| Eligible voters | 66,467 | |||||||
| Liberal gain from Conservative | Swing | -4.28 | ||||||
2006 general election
| 2006 Canadian federal election | ||||||||
|---|---|---|---|---|---|---|---|---|
| Party | Candidate | Votes | % | ±% | Expenditures | |||
| Conservative | Loyola Hearn | 16,644 | 44.68 | +5.11 | $67,639.04 | |||
| Liberal | Siobhán Coady | 12,295 | 33.00 | -2.26 | $68,791.05 | |||
| New Democratic | Peg Norman | 8,079 | 21.69 | -2.02 | $40,492.63 | |||
| Green | Barry Crozier | 235 | 0.63 | -0.83 | none listed | |||
| Total valid votes/expense limit | 37,253 | 100.0 | – | $73,776 | ||||
| Total rejected, declined and unmarked ballots | 124 | 0.33 | +0.03 | |||||
| Turnout | 37,371 | 57.90 | +5.42 | |||||
| Eligible voters | 64,543 | |||||||
| Conservative hold | Swing | +3.68 | ||||||
St. John's South
2004 general election
| 2004 Canadian federal election | ||||||||
|---|---|---|---|---|---|---|---|---|
| Party | Candidate | Votes | % | ±% | Expenditures | |||
| Conservative | Loyola Hearn | 13,330 | 39.57 | -16.27 | $63,090.26 | |||
| Liberal | Siobhán Coady | 11,879 | 35.26 | +4.91 | $63,121.27 | |||
| New Democratic | Peg Norman | 7989 | 23.71 | +10.31 | $36,839.75 | |||
| Green | Steve Willcott | 493 | 1.46 | – | $184.24 | |||
| Total valid votes/expense limit | 33,691 | 100.0 | – | $72,104 | ||||
| Total rejected, declined and unmarked ballots | 103 | 0.30 | ||||||
| Turnout | 33,794 | 52.48 | -1.38 | |||||
| Eligible voters | 64,397 | |||||||
| Conservative notional gain from Progressive Conservative | Swing | -10.59 | ||||||
| Changes from 2000 are based on redistributed results. Change for the Conservatives is based on the combined totals of the Progressive Conservatives and the Canadian Alliance. | ||||||||
| 2000 federal election redistributed results | |||
|---|---|---|---|
| Party | Vote | % | |
| Progressive Conservative | 18,610 | 53.65 | |
| Liberal | 10,526 | 30.35 | |
| New Democratic | 4,647 | 13.40 | |
| Alliance | 761 | 2.19 | |
| Others | 142 | 0.41 | |
Student vote results
Results of the Canadian student vote.
2019 student vote results
| 2019 Canadian federal election | ||||||||
|---|---|---|---|---|---|---|---|---|
| Party | Candidate | Votes | % | ±% | ||||
| Liberal | Seamus O'Regan | 1,498 | 38.03 | -16.91 | ||||
| New Democratic | Anne Marie Anonsen | 944 | 23.97 | -8.42 | ||||
| Conservative | Terry Martin | 574 | 14.57 | +9.41 | ||||
| Green | Alexandra Hayward | 445 | 11.3 | 3.78 | ||||
| People's | Benjamin Ruckpaul | 259 | 6.58 | New | ||||
| Christian Heritage | David Jones | 219 | 5.56 | New | ||||
| Total valid votes | 3,939 | 100.0 | ||||||
| [11] | ||||||||
2015 student vote results
| 2015 Canadian federal election | ||||||||
|---|---|---|---|---|---|---|---|---|
| Party | Candidate | Votes | % | ±% | ||||
| Liberal | Seamus O'Regan | 1,257 | 54.94 | +22.45 | ||||
| New Democratic | Ryan Cleary | 741 | 32.39 | -5.18 | ||||
| Green | Jackson McLean | 172 | 7.52 | -4.9 | ||||
| Conservative | Marek Krol | 118 | 5.16 | -12.34 | ||||
| Total valid votes | 2,288 | 100.0 | ||||||
| [12] | ||||||||
2011 student vote results
| 2011 Canadian federal election | ||||||||
|---|---|---|---|---|---|---|---|---|
| Party | Candidate | Votes | % | |||||
| New Democratic | Ryan Cleary | 614 | 37.57 | |||||
| Liberal | Siobhan Coady | 531 | 32.49 | |||||
| Conservative | Loyola Sullivan | 286 | 17.5 | |||||
| Green | Rick Austin | 203 | 12.42 | |||||
| Total valid votes | 1,634 | 100.0 | ||||||
| [13] | ||||||||
See also
- List of Canadian federal electoral districts
- Past Canadian electoral districts
References
- "(Code 10007) Census Profile". 2011 census. Statistics Canada. 2012. Retrieved March 3, 2011.
- Statistics Canada: 2012
- Report – Newfoundland and Labrador
- Timeline for the Redistribution of Federal Electoral Districts
- "Confirmed candidates — St. John's South—Mount Pearl". Elections Canada. Retrieved September 20, 2021.
- "Results Validated by the Returning Officer". Elections Canada. Retrieved October 25, 2019.
- "October 19, 2015 Election Results — St. John's South—Mount Pearl (Validated results)". Elections Canada. October 21, 2015. Retrieved October 24, 2015.
- Elections Canada – Preliminary Election Expenses Limits for Candidates
- Pundits' Guide to Canadian Elections
- Elections Canada – Official voting results, Forty-first general election, 2011
- Elections Canada – Candidate's electoral campaign return, 41st general election
- "Student Vote Canada 2019". Retrieved July 29, 2020.
- "Student Vote". Retrieved July 29, 2020.
- "District results". Student Vote. Archived from the original on May 6, 2015. Retrieved July 29, 2020.
External links
- St. John's South—Mount Pearl riding from Elections Canada
- Riding history for St. John's South (2003–2004) from the Library of Parliament
- Riding history for St. John's South—Mount Pearl (2004– ) from the Library of Parliament
- Election Financial Reports from Elections Canada
Другой контент может иметь иную лицензию. Перед использованием материалов сайта WikiSort.org внимательно изучите правила лицензирования конкретных элементов наполнения сайта.
WikiSort.org - проект по пересортировке и дополнению контента Википедии