world.wikisort.org - Canada
Sainte-Françoise is a parish municipality in the Bas-Saint-Laurent region of Quebec, Canada.
Sainte-Françoise | |
|---|---|
Parish municipality | |
 | |
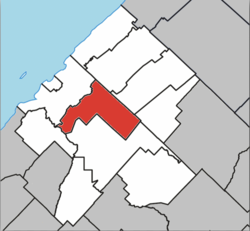 Location within Les Basques RCM | |
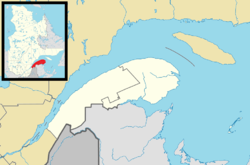 Sainte-Françoise Location in eastern Quebec | |
| Coordinates: 48.1°N 69.07°W[1] | |
| Country | |
| Province | |
| Region | Bas-Saint-Laurent |
| RCM | Les Basques |
| Constituted | December 6, 1873 |
| Government | |
| • Mayor | Simon Lavoie |
| • Federal riding | Rimouski-Neigette—Témiscouata —Les Basques |
| • Prov. riding | Rivière-du-Loup-Témiscouata |
| Area | |
| • Total | 89.40 km2 (34.52 sq mi) |
| • Land | 88.07 km2 (34.00 sq mi) |
| Population (2011)[3] | |
| • Total | 399 |
| • Density | 4.5/km2 (12/sq mi) |
| • Pop 2006-2011 | |
| • Dwellings | 229 |
| Time zone | UTC−5 (EST) |
| • Summer (DST) | UTC−4 (EDT) |
| Postal code(s) | G0L 3B0 |
| Area code(s) | 418 and 581 |
| Highways | |
Demographics
| Year | Pop. | ±% |
|---|---|---|
| 1991 | 506 | — |
| 1996 | 467 | −7.7% |
| 2001 | 453 | −3.0% |
| 2006 | 431 | −4.9% |
| 2011 | 399 | −7.4% |
In the 2021 Census of Population conducted by Statistics Canada, Sainte-Françoise had a population of 383 living in 192 of its 209 total private dwellings, a change of -0.8% from its 2016 population of 386. With a land area of 88.83 km2 (34.30 sq mi), it had a population density of 4.3/km2 (11.2/sq mi) in 2021.[5]
Canada census – Sainte-Françoise community profile
| 2021 | 2011 | |
|---|---|---|
| Population | 383 (-0.8% from 2016) | 399 (-7.4% from 2006) |
| Land area | 88.83 km2 (34.30 sq mi) | 88.07 km2 (34.00 sq mi) |
| Population density | 4.3/km2 (11/sq mi) | 4.5/km2 (12/sq mi) |
| Median age | 56 (M: 55.6, F: 56) | 52.6 (M: 53.5, F: 51.6) |
| Total private dwellings | 190 | 229 |
| Median household income | $40,716 |
| Canada Census Mother Tongue - Sainte-Françoise, Bas-Saint-Laurent, Quebec[4] | ||||||||||||||||||
|---|---|---|---|---|---|---|---|---|---|---|---|---|---|---|---|---|---|---|
| Census | Total | French |
English |
French & English |
Other | |||||||||||||
| Year | Responses | Count | Trend | Pop % | Count | Trend | Pop % | Count | Trend | Pop % | Count | Trend | Pop % | |||||
2011 |
405 |
395 | 97.53% | 5 | 1.23% | 5 | 1.23% | 0 | 0.00% | |||||||||
2006 |
420 |
410 | 97.62% | 0 | 0.00% | 0 | 0.00% | 10 | 2.38% | |||||||||
2001 |
450 |
450 | 100.00% | 0 | 0.00% | 0 | 0.00% | 0 | 0.00% | |||||||||
1996 |
465 |
465 | n/a | 100.00% | 0 | n/a | 0.00% | 0 | n/a | 0.00% | 0 | n/a | 0.00% | |||||
See also
- List of parish municipalities in Quebec
References
- "Reference number 56176 in Banque de noms de lieux du Québec". toponymie.gouv.qc.ca (in French). Commission de toponymie du Québec.
- "Geographic code 11030 in the official Répertoire des municipalités". www.mamh.gouv.qc.ca (in French). Ministère des Affaires municipales et de l'Habitation.
- "(Code 2411030) Census Profile". 2011 census. Statistics Canada. 2012.
- Statistics Canada: 1996, 2001, 2006, 2011 census
- "Population and dwelling counts: Canada, provinces and territories, and census subdivisions (municipalities), Quebec". Statistics Canada. February 9, 2022. Retrieved August 29, 2022.
- "2021 Community Profiles". 2021 Canadian Census. Statistics Canada. February 4, 2022. Retrieved 2022-04-27.
- "2011 Community Profiles". 2011 Canadian Census. Statistics Canada. March 21, 2019. Retrieved 2014-03-11.
- "2006 Community Profiles". 2006 Canadian Census. Statistics Canada. August 20, 2019.
- "2001 Community Profiles". 2001 Canadian Census. Statistics Canada. July 18, 2021.
External links
 Media related to Sainte-Françoise, Bas-Saint-Laurent, Quebec at Wikimedia Commons
Adjacent Municipal Subdivisions | ||||||||||||||||
|---|---|---|---|---|---|---|---|---|---|---|---|---|---|---|---|---|
| ||||||||||||||||
| Cities & Towns |
|
|---|---|
| Municipalities |
|
| Parishes |
|
| Unorganized territories | |
| |
This Bas-Saint-Laurent location article is a stub. You can help Wikipedia by expanding it. |
Текст в блоке "Читать" взят с сайта "Википедия" и доступен по лицензии Creative Commons Attribution-ShareAlike; в отдельных случаях могут действовать дополнительные условия.
Другой контент может иметь иную лицензию. Перед использованием материалов сайта WikiSort.org внимательно изучите правила лицензирования конкретных элементов наполнения сайта.
Другой контент может иметь иную лицензию. Перед использованием материалов сайта WikiSort.org внимательно изучите правила лицензирования конкретных элементов наполнения сайта.
2019-2025
WikiSort.org - проект по пересортировке и дополнению контента Википедии
WikiSort.org - проект по пересортировке и дополнению контента Википедии