world.wikisort.org - CanadaSaint John—Rothesay (formerly Saint John) is a federal electoral district in southern New Brunswick, Canada. With its predecessor ridings, St. John—Albert and Saint John—Lancaster, the area has been represented in the House of Commons of Canada since 1917.
Federal electoral district in New Brunswick, Canada
Saint John—Rothesay New Brunswick electoral district New Brunswick electoral district |
|---|
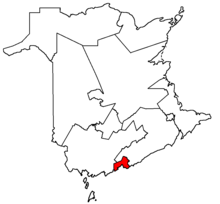 Saint John in relation to other New Brunswick federal electoral districts |
| Coordinates: | 45.292°N 66.034°W / 45.292; -66.034 |
|---|
|
| Legislature | House of Commons |
|---|
| MP | Wayne Long
Liberal |
|---|
| District created | 1914 |
|---|
| First contested | 1917 |
|---|
| Last contested | 2021 |
|---|
| District webpage | profile, map |
|---|
|
| Population (2016)[1] | 79,363 |
|---|
| Electors (2019) | 63,371 |
|---|
| Area (km²)[1] | 457 |
|---|
| Pop. density (per km²) | 173.7 |
|---|
| Census division(s) | Kings, Saint John |
|---|
| Census subdivision(s) | Rothesay, Saint John, Simonds, The Brothers 18 |
|---|
The district has always included the city of Saint John, and various suburbs and bedroom communities have been added or removed from it over the years. Presently the district also includes the town of Rothesay, the Indian reserve of Brothers 18 and part of Simonds Parish.
The neighbouring ridings are Fundy Royal and New Brunswick Southwest.
History
Originally, Saint John had a special setup for representation in Parliament. The "City of St. John" returned one member, while the "City and County of St. John", which included the County of Saint John returned one as well. Between 1872 and 1896, the "City and County" riding elected two Members of Parliament. In effect, the city itself had two or even three Members of Parliament. This practice continued until 1914.
After 1914, the counties of Saint John and Albert were joined. The two existing ridings were merged into a new riding, called "St. John—Albert", that also incorporated parts of King's and Albert riding. The new riding returned two Members of Parliament until 1935.
In 1966, St. John—Albert was abolished when Albert County was moved to the Fundy—Royal riding. A new riding, "Saint John—Lancaster", was created.
Saint John—Lancaster was abolished in the 1976 redistribution, and a new riding with substantially the same boundaries was created and named "Saint John". The City of Lancaster had been amalgamated into Saint John.
In recent years, the Progressive Conservative Party has had the most success in the city: its members were elected in all but four elections since 1953: 1974, 1980, 2004, and 2006. Well-known Members of Parliament from the area include Father of Confederation Samuel Leonard Tilley, former Veterans Affairs Minister Gerald Merrithew and popular former mayor Elsie Wayne.
As per the 2012 federal electoral redistribution, this riding was renamed Saint John—Rothesay and lost a small portion of territory to Fundy Royal.
Historical population| Year | Pop. | ±% |
|---|
| 2001 | 83,463 | — |
|---|
| 2006 | 82,078 | −1.7% |
|---|
| 2011 | 84,670 | +3.2% |
|---|
Members of Parliament
These ridings have elected the following Members of Parliament:
| Parliament |
Years |
Member |
Party |
Member |
Party |
St. John—Albert
Riding created from City and County of St. John |
| 13th |
1917 – 1921 |
|
Rupert Wilson Wigmore |
Government (Unionist) |
|
Stanley Edward Elkin |
Government (Unionist) |
| 14th |
1921 – 1925 |
|
John Babington Macaulay Baxter |
Conservative |
|
Murray MacLaren |
Conservative |
| 15th |
1925 – 1926 |
Thomas Bell |
| 16th |
1926 – 1930 |
| 17th |
1930 – 1935 |
| 18th |
1935 – 1938 |
|
William Ryan |
Liberal |
| 1938 – 1940 |
Allan McAvity |
| 19th |
1940 – 1945 |
|
King Hazen |
National Government |
| 20th |
1945 – 1949 |
|
Progressive Conservative |
| 21st |
1949 – 1953 |
|
Daniel Aloysius Riley |
Liberal |
| 22nd |
1953 – 1957 |
|
Thomas Miller Bell |
Progressive Conservative |
| 23rd |
1957 – 1958 |
| 24th |
1958 – 1962 |
| 25th |
1962 – 1963 |
| 26th |
1963 – 1965 |
| 27th |
1965 – 1968 |
| St. John—Lancaster |
| 28th |
1968 – 1972 |
|
Thomas Miller Bell |
Progressive Conservative |
| 29th |
1972 – 1974 |
| 30th |
1974 – 1979 |
|
Mike Landers |
Liberal |
| Saint John |
| 31st |
1979 – 1980 |
|
Eric Ferguson |
Progressive Conservative |
| 32nd |
1980 – 1984 |
|
Mike Landers |
Liberal |
| 33rd |
1984 – 1988 |
|
Gerald Merrithew |
Progressive Conservative |
| 34th |
1988 – 1993 |
| 35th |
1993 – 1997 |
Elsie Wayne |
| 36th |
1997 – 2000 |
| 37th |
2000 – 2003 |
| 2003 – 2004 |
|
Conservative |
| 38th |
2004 – 2006 |
|
Paul Zed |
Liberal |
| 39th |
2006 – 2008 |
| 40th |
2008 – 2011 |
|
Rodney Weston |
Conservative |
| 41st |
2011 – 2015 |
| Saint John—Rothesay |
| 42nd |
2015–2019 |
|
Wayne Long |
Liberal |
| 43rd |
2019–2021 |
| 43rd |
2021–present |
Election results
Graph of election results in St. John—Albert, Saint John—Lancaster, Saint John, Saint John—Rothesay (1914-2019 minor parties that never got 2% of the vote or didn't run consistently are omitted, prior to 1968 the top two candidates were both elected)
Saint John—Rothesay, 2013 representation order
Graph of election results in Saint John—Rothesay (2013- minor parties that never got 2% of the vote or didn't run consistently are omitted, prior to 1968 the top two candidates were both elected)
| 2021 Canadian federal election |
| ** Preliminary results — Not yet official ** |
| Party |
Candidate |
Votes | % | | Expenditures |
|
Liberal | Wayne Long | 17,371 | 46.38 | +8.94 | |
|
Conservative | Mel Norton | 12,315 | 32.88 | -1.07 | |
|
New Democratic | Don Paulin | 4,821 | 12.87 | +0.64 | |
|
People's | Nicholas Pereira | 2,001 | 5.34 | +2.29 | |
|
Green | Ann McAllister | 948 | 2.53 | -7.57 | |
| Total valid votes |
37,456 |
| Total rejected ballots |
|
| Turnout |
| 58.99 | -6.19 |
| Registered voters |
63,495 |
| Source: Elections Canada[2] |
|
Liberal hold |
Swing |
+5.01 |
| 2019 Canadian federal election |
| Party |
Candidate |
Votes | % | | Expenditures |
|
Liberal | Wayne Long | 15,443 | 37.43 | -11.37 | $65,376.07 |
|
Conservative | Rodney Weston | 14,006 | 33.95 | +3.41 | $98,624.09 |
|
New Democratic | Armand Cormier | 5,046 | 12.23 | -5.30 | $2,746.93 |
|
Green | Ann McAllister | 4,165 | 10.10 | +6.97 | none listed |
|
People's | Adam J. C. Salesse | 1,260 | 3.05 | | none listed |
|
Independent | Stuart Jamieson | 1,183 | 2.87 | | $6,611.27 |
|
Independent | Neville Barnett | 150 | 0.36 | | $170.00 |
| Total valid votes/expense limit |
41,253 | 99.40 |
| Total rejected ballots |
250 | 0.60 | +0.12 |
| Turnout |
41,503 | 65.18 | -3.65 |
| Eligible voters |
63,677 |
|
Liberal hold |
Swing |
-7.39 |
| Source: Elections Canada[3][4] |
| 2015 Canadian federal election: Saint_John—Rothesay |
| Party |
Candidate |
Votes | % | | Expenditures |
|
Liberal | Wayne Long | 20,634 | 48.80 | +32.81 | – |
|
Conservative | Rodney Weston | 12,915 | 30.54 | -19.18 | – |
|
New Democratic | AJ Griffin | 7,411 | 17.53 | -13.2 | – |
|
Green | Sharon Murphy | 1,321 | 3.12 | +0.35 | – |
| Total valid votes/expense limit |
42,281 | 100.0 | | $196,334.01 |
| Total rejected ballots |
205 | – | – |
| Turnout |
42,486 | 69.38 | – |
| Eligible voters |
61,236 |
| Source: Elections Canada[5][6] |
| 2011 federal election redistributed results[7] |
| Party |
Vote |
% |
| |
Conservative | 17,881 | 49.72 |
| |
New Democratic | 11,052 | 30.73 |
| |
Liberal | 5,750 | 15.99 |
| |
Green | 992 | 2.76 |
| |
Others | 288 | 0.80 |
Saint John, 2003 Representation Order
Graph of election results in Saint John (1976-2013 minor parties that never got 2% of the vote or didn't run consistently are omitted, prior to 1968 the top two candidates were both elected)
| 2011 Canadian federal election |
| Party |
Candidate |
Votes | % | | Expenditures |
|
Conservative | Rodney Weston | 18,456 | 49.73 | +10.18 | $79,348.63 |
|
New Democratic | Rob Moir | 11,382 | 30.67 | +14.71 | $23,584.68 |
|
Liberal | Stephen Chase | 5,964 | 16.07 | -22.06 | $42,496.31 |
|
Green | Sharon Murphy-Flatt | 1,017 | 2.74 | -2.68 | $2,700.77 |
|
Independent | Arthur Watson Jr. | 294 | 0.79 | – | $251.37 |
| Total valid votes/expense limit |
37,113 | 100.0 | | $82,011.29 |
| Total rejected, unmarked and declined ballots |
176 | 0.47 |
| Turnout |
37,289 | 58.02 | +4.01 |
| Eligible voters |
64,264 |
|
Conservative hold |
Swing |
-2.26 |
| Sources:[8][9] |
| 2008 Canadian federal election |
| Party |
Candidate |
Votes | % | | Expenditures |
|
Conservative | Rodney Weston | 13,782 | 39.55 | +0.25 | $73,497.84 |
|
Liberal | Paul Zed | 13,285 | 38.13 | -4.79 | $69,234.99 |
|
New Democratic | Tony Mowery | 5,560 | 15.96 | +0.32 | $2,720.91 |
|
Green | Mike Richardson | 1,888 | 5.42 | +3.28 | $1,008.49 |
|
Marijuana | Michael Moffat | 330 | 0.95 | – | none listed |
| Total valid votes/expense limit |
34,845 | 100.0 | | $79,702 |
| Total rejected, unmarked and declined ballots |
187 | 0.53 | ±0 |
| Turnout |
35,032 | 54.01 | -7.38 |
| Eligible voters |
64,868 |
|
Conservative gain from Liberal |
Swing |
+2.52 |
| 2006 Canadian federal election |
| Party |
Candidate |
Votes | % | | Expenditures |
|
Liberal | Paul Zed | 17,202 | 42.92 | -0.36 | $55,428.82 |
|
Conservative | John Wallace | 15,753 | 39.30 | +5.68 | $65,915.16 |
|
New Democratic | Terry Albright | 6,267 | 15.64 | -3.42 | $6,294.91 |
|
Green | Vern Garnett | 858 | 2.14 | -0.08 | none listed |
| Total valid votes/expense limit |
40,080 | 100.0 | | $74,214 |
| Total rejected, unmarked and declined ballots |
214 | 0.53 |
| Turnout |
40,294 | 61.39 | +6.36 |
| Eligible voters |
65,639 |
|
Liberal hold |
Swing |
-3.02 |
| 2004 Canadian federal election |
| Party |
Candidate |
Votes | % | | Expenditures |
|
Liberal | Paul Zed | 15,725 | 43.28 | +13.12 | $60,257.89 |
|
Conservative | Bob McVicar | 12,212 | 33.62 | -25.88 | $59,750.72 |
|
New Democratic | Terry Albright | 6,926 | 19.06 | +10.34 | $13,450.03 |
|
Green | Jonathan Cormier | 807 | 2.22 | +1.92 | $1,401.24 |
|
Marijuana | Jim Wood | 369 | 1.02 | -0.38 | none listed |
|
Independent | Tom Oland | 290 | 0.80 | – | $235.21 |
| Total valid votes/expense limit |
36,329 | 100.0 | | $73,296 |
| Total rejected, unmarked and declined ballots |
224 | 0.61 |
| Turnout |
36,553 | 55.03 | -5.46 |
| Eligible voters |
66,423 |
|
Liberal notional gain from Progressive Conservative |
Swing |
+19.50 |
| Changes from 2000 are based on redistributed results. Change for the Conservative Party is based on the combined total of the Progressive Conservative Party and the Canadian Alliance. |
| 2000 federal election redistributed results |
| Party |
Vote |
% |
| |
Progressive Conservative | 19,236 | 49.05 |
| |
Liberal | 11,829 | 30.16 |
| |
Alliance | 4,099 | 10.45 |
| |
New Democratic | 3,421 | 8.72 |
| |
Others | 635 | 1.62 |
Saint John, 1996 Representation Order
| 2000 Canadian federal election |
| Party |
Candidate |
Votes | % | |
|
Progressive Conservative | Elsie Wayne | 16,751 | 50.9 | -12.2 |
|
Liberal | Paul Zed | 9,535 | 29.0 | +13.1 |
|
New Democratic | Rod Hill | 2,989 | 9.1 | -1.3 |
|
Alliance | Peter Touchbourne | 2,980 | 9.1 | -0.7 |
|
Marijuana | Jim Wood | 461 | 1.4 | +1.4 |
|
Green | Vern Garnett | 131 | 0.3 | +0.3 |
|
Natural Law | Miville Couture | 52 | 0.2 | -0.5 |
| Total valid votes |
32,899 | 100.0 |
| 1997 Canadian federal election |
| Party |
Candidate |
Votes | % | |
|
Progressive Conservative | Elsie Wayne | 22,227 | 63.1 | +19.8 |
|
Liberal | Diana Alexander | 5,612 | 15.9 | -17.7 |
|
New Democratic | Larry Hanley | 3,679 | 10.4 | +6.3 |
|
Reform | George Richardson | 3,467 | 9.8 | +3.6 |
|
Natural Law | Christopher B. Collrin | 232 | 0.7 | n/c |
| Total valid votes |
35,217 | 100.0 |
Saint John, previous elections
| 1993 Canadian federal election |
| Party |
Candidate |
Votes | % | |
|
Progressive Conservative | Elsie Wayne | 15,123 | 43.3 | +0.2 |
|
Liberal | Pat Landers | 11,736 | 33.6 | -5.0 |
|
Independent | Joe Boyce | 3,685 | 10.6 | +10.6 |
|
Reform | John Erbs | 2,171 | 6.2 | +6.2 |
|
New Democratic | Shirley Brown | 1,443 | 4.1 | -8.4 |
|
Canada Party | Jim Webb | 368 | 1.1 | +1.1 |
|
Natural Law | Christopher Collrin | 252 | 0.7 | +0.7 |
|
National | Joy Hobson | 146 | 0.4 | +0.4 |
| Total valid votes |
34,924 | 100.0 |
| 1988 Canadian federal election |
| Party |
Candidate |
Votes | % | |
|
Progressive Conservative | Gerry Merrithew | 16,798 | 43.1 | -9.1 |
|
Liberal | Joe Boyce | 15,067 | 38.6 | +13.1 |
|
New Democratic | Judith Meinert | 4,883 | 12.5 | -8.7 |
|
Confederation of Regions | Jim Webb | 1,806 | 4.6 | +4.6 |
|
Libertarian | Thomas Gamblin | 289 | 0.7 | -0.1 |
|
Independent | Gary Zatzman | 162 | 0.4 | +0.4 |
| Total valid votes |
39,005 | 100.0 |
| 1984 Canadian federal election |
| Party |
Candidate |
Votes | % | |
|
Progressive Conservative | Gerry Merrithew | 16,604 | 52.2 | +13.2 |
|
Liberal | Cliff Warner | 8,109 | 25.5 | -15.9 |
|
New Democratic | Mary Palmer | 6,752 | 21.2 | +2.3 |
|
Libertarian | Peter Jones | 242 | 0.8 | +0.6 |
|
Social Credit | Gordon Simons | 102 | 0.3 | +0.3 |
| Total valid votes |
31,809 | 100.0 |
| 1980 Canadian federal election |
| Party |
Candidate |
Votes | % | |
|
Liberal | Mike Landers | 13,122 | 41.4 | +1.8 |
|
Progressive Conservative | Eric Ferguson | 12,363 | 39.0 | -2.6 |
|
New Democratic | David M. Brown | 5,978 | 18.9 | +0.0 |
|
Independent | Marilynn Fox | 103 | 0.3 | - |
|
Libertarian | Peter Jones | 66 | 0.2 | - |
|
Marxist–Leninist | Gilles DesRosiers | 35 | 0.1 | - |
| Total valid votes |
31,667 | 100.0 |
| 1979 Canadian federal election |
| Party |
Candidate |
Votes | % | |
|
Progressive Conservative | Eric Ferguson | 13,989 | 41.6 | +0.6 |
|
Liberal | Mike Landers | 13,316 | 39.6 | -6.5 |
|
New Democratic | Eldon Richardson | 6,358 | 18.9 | +6.5 |
| Total valid votes |
33,663 | 100.0 |
Saint John—Lancaster, 1966–1976
Graph of election results in Saint John—Lancaster (1966-1976 minor parties that never got 2% of the vote or didn't run consistently are omitted, prior to 1968 the top two candidates were both elected)
| 1974 Canadian federal election |
| Party |
Candidate |
Votes | % | |
|
Liberal | Mike Landers | 12,860 | 46.1 | +3.9 |
|
Progressive Conservative | Tom Bell | 11,419 | 41.0 | -12.9 |
|
New Democratic | Eldon Richardson | 3,457 | 12.4 | +9.9 |
|
Marxist–Leninist | Jay Baxter | 118 | 0.4 | +0.4 |
| Total valid votes |
27,854 | 100.0 |
| 1972 Canadian federal election |
| Party |
Candidate |
Votes | % | |
|
Progressive Conservative | Tom Bell | 16,350 | 53.9 | +0.9 |
|
Liberal | William Ryan | 12,783 | 42.2 | +1.2 |
|
New Democratic | Joe Drummond | 788 | 2.5 | -2.6 |
|
Social Credit | Tom Enright | 394 | 1.3 | +1.3 |
| Total valid votes |
30,315 | 100.0 |
| 1968 Canadian federal election |
| Party |
Candidate |
Votes | % | |
|
Progressive Conservative | Tom Bell | 15,756 | 53.0 | +1.6 |
|
Liberal | William Ryan | 12,160 | 41.0 | +4.4 |
|
New Democratic | Eldon Richardson | 1,508 | 5.1 | -6.8 |
|
Independent | Mildred Crawford | 268 | 0.9 | +0.9 |
| Total valid votes |
29,692 | 100.0 |
St. John—Albert 1914–1966
Graph of election results in St. John—Albert (1914-1966 minor parties that never got 2% of the vote or didn't run consistently are omitted, prior to 1968 the top two candidates were both elected)
| 1965 Canadian federal election |
| Party |
Candidate |
Votes | % | |
|
Progressive Conservative | Tom Bell | 21,909 | 51.4 | -0.3 |
|
Liberal | Arthur Whelly | 15,609 | 36.6 | -3.3 |
|
New Democratic | Eldon Richardson | 5,081 | 11.9 | +7.4 |
| Total valid votes |
42,599 | 100.0 |
| 1963 Canadian federal election |
| Party |
Candidate |
Votes | % | |
|
Progressive Conservative | Tom Bell | 21,584 | 51.7 | -0.1 |
|
Liberal | Arthur Whelly | 16,669 | 39.9 | +1.4 |
|
New Democratic | John Simonds | 1,869 | 4.5 | -1.6 |
|
Social Credit | Paul Sherwood | 1,606 | 3.8 | +0.1 |
| Total valid votes |
41,728 | 100.0 |
| 1962 Canadian federal election |
| Party |
Candidate |
Votes | % | |
|
Progressive Conservative | Tom Bell | 22,586 | 51.8 | -12.1 |
|
Liberal | George Urquhart | 16,790 | 38.5 | +5.6 |
|
New Democratic | Eldon Richardson | 2,641 | 6.1 | +2.8 |
|
Social Credit | Harvey Lainson | 1,608 | 3.7 | +3.7 |
| Total valid votes |
43,625 | 100.0 |
| 1958 Canadian federal election |
| Party |
Candidate |
Votes | % | |
|
Progressive Conservative | Tom Bell | 21,983 | 63.9 | +10.3 |
|
Liberal | George McLeod | 13,917 | 32.9 | -13.5 |
|
Co-operative Commonwealth | Eldon Richardson | 1,394 | 3.3 | +3.3 |
| Total valid votes |
37,294 | 100.0 |
| 1957 Canadian federal election |
| Party |
Candidate |
Votes | % | |
|
Progressive Conservative | Tom Bell | 21,983 | 53.6 | +4.1 |
|
Liberal | Daniel Riley | 19,047 | 46.4 | -1.7 |
| Total valid votes |
41,030 | 100.0 |
| 1953 Canadian federal election |
| Party |
Candidate |
Votes | % | |
|
Progressive Conservative | Tom Bell | 18,881 | 49.5 | +4.8 |
|
Liberal | Daniel Riley | 18,338 | 48.1 | -0.8 |
|
Co-operative Commonwealth | Raymond McAfee | 933 | 2.4 | -4.0 |
| Total valid votes |
38,152 | 100.0 |
| 1949 Canadian federal election |
| Party |
Candidate |
Votes | % | |
|
Liberal | Daniel Riley | 18,691 | 48.9 | +7.8 |
|
Progressive Conservative | King Hazen | 17,052 | 44.7 | -2.1 |
|
Co-operative Commonwealth | Raymond McAfee | 2,445 | 6.4 | -5.6 |
| Total valid votes |
38,188 | 100.0 |
| 1945 Canadian federal election |
| Party |
Candidate |
Votes | % | |
|
Progressive Conservative | King Hazen | 16,205 | 46.8 | -3.5 |
|
Liberal | David Lawrence MacLaren | 14,248 | 41.1 | -6.1 |
|
Co-operative Commonwealth | William Arrowsmith | 761 | 12.0 | +9.5 |
| Total valid votes |
31,214 | 100.0 |
| 1940 Canadian federal election |
| Party |
Candidate |
Votes | % | |
|
National Government | King Hazen | 15,110 | 50.3 | +13.4 |
|
Liberal | Allan McAvity | 14,197 | 47.2 | -0.8 |
|
Co-operative Commonwealth | James Fritch | 761 | 2.5 | +2.5 |
| Total valid votes |
30,068 | 100.0 |
Note: popular vote is compared to 1935 general election.
| By-election on February 21, 1938
On William Ryan's death, April 1, 1938 |
| Party |
Candidate |
Votes
|
|
Liberal | Allan McAvity | acclaimed |
| 1935 Canadian federal election |
| Party |
Candidate |
Votes | % | |
|
Liberal | William Ryan | 15,125 | 48.0 | +13.9 |
|
Conservative | Douglas King Hazen | 11,643 | 36.9 | -19.0 |
|
Reconstruction | Paul Cross | 4,094 | 13.0 | |
|
Independent Liberal | Howe Cowan | 672 | 2.1 | |
| Total valid votes |
31,534 | 100.0 |
Note: popular vote is compared to the party's total share of the popular vote in the 1930 general election.
| 1930 Canadian federal election |
| Party |
Candidate |
Votes | % | Elected |
|
Conservative | Murray MacLaren | 16,454 | 33.0 |  Y Y |
|
Conservative | Thomas Bell | 16,395 | 32.9 | Y |
|
Liberal | Allan McAvity | 8,595 | 17.3 |
|
Liberal | William Ryan | 8,371 | 16.8 |
| Total valid votes |
49,815 | 100.0 |
Total Conservative vote: 32,849, or 65.9% of the total, an increase of 4.2% from the 1926 general election.
Total Liberal vote: 16,966, or 34.1%, a decrease of 4.2% from the 1926 general election.
| 1926 Canadian federal election |
| Party |
Candidate |
Votes | % | Elected |
|
Conservative | Murray MacLaren | 12,441 | 31.0 | Y |
|
Conservative | Thomas Bell | 12,310 | 30.7 | Y |
|
Liberal | William Michael Ryan | 8,007 | 20.0 | |
|
Liberal | Robert Thomas Hayes | 7,356 | 18.3 | |
| Total valid votes |
40,114 | 100.0% |
Total Conservative vote: 24,751, or 61.7% of the total, a decrease of 0.2% from the 1925 general election.
Total Liberal vote: 15,363, or 38.3% of the total, an increase of 0.2% from the 1925 general election.
| 1925 Canadian federal election |
| Party |
Candidate |
Votes | % | Elected |
|
Conservative | Murray MacLaren | 14,623 | 31.3 | Y |
|
Conservative | Thomas Bell | 14,250 | 30.5 | Y |
|
Liberal | Walter Edward Foster | 9,348 | 20.0 |
|
Liberal | Robert Thomas Hayes | 8,435 | 18.1 |
| Total valid votes |
46,656 | 100.0 |
Total Conservative vote: 28,873, or 61.9% of the total, an increase of 11.6% from the 1921 general election.
Total Liberal vote: 17,783, or 38.1% of the total, a decrease of 6.7% from the 1921 general election.
| 1921 Canadian federal election |
| Party |
Candidate |
Votes | % | Elected |
|
Conservative | John Babington Baxter | 11,646 | 26.0 | Y |
|
Conservative | Murray MacLaren | 10,901 | 24.3 | Y |
|
Liberal | Harry Richards McLellan | 10,531 | 23.5 | |
|
Liberal | William Patrick Broderick | 9,546 | 21.3 | |
|
Progressive | Frederick Alexander Campbell | 1,224 | 2.7 | |
|
Progressive | William Mayhew Calhoun | 985 | 2.2 | |
| Total valid votes |
44,833 | 100.0 |
Total Conservative vote: 22,547, or 50.3% of the total, an increase of 0.3% from the 1920 by-election.
Total Liberal vote: 20,077, or 44.8% of the total, a decrease of 5.2% from the 1920 by-election.
Total Progressive vote: 2,209, or 4.9% of the total.
| By-election on September 20, 1920 |
| Party |
Candidate |
Votes |
% |
±% |
|
Conservative | Rupert Wilson Wigmore | 13,611 | 50.0 | -20.8 |
|
Liberal | Alban Frederick Emery | 13,594 | 50.0 | +20.8 |
| Total valid votes |
27,205 | 100.0 |
Note: Conservative vote is compared to Government vote in 1917 election, and Liberal vote is compared to Opposition vote. Popular vote is compared to the party's total share of the popular vote in the 1917 general election.
| 1917 Canadian federal election |
| Party |
Candidate |
Votes | % | Elected |
|
Government (Unionist) | Rupert Wilson Wigmore | 13,611 | 35.4 | Y |
|
Government (Unionist) | Stanley Edward Elkin | 13,594 | 35.4 | Y |
|
Liberal | William Patrick Broderick | 5,694 | 14.8 | |
|
Liberal | Alban Frederick Emery | 5,530 | 14.4 | |
| Total valid votes |
38,429 | 100.0 |
Total Conservative vote: 27,205, or 70.8% of the total.
Total Liberal vote: 11,224, or 29.2% of the total.
See also
- List of Canadian federal electoral districts
- Past Canadian electoral districts
References
Notes
External links
Federal ridings in New Brunswick |
|---|
| Liberal |
- Acadie—Bathurst
- Beauséjour
- Fredericton
- Madawaska—Restigouche
- Miramichi—Grand Lake
- Moncton—Riverview—Dieppe
- Saint John—Rothesay
|
|---|
| Conservative | |
|---|
Federal ridings in Atlantic Canada |
|---|
| Newfoundland and Labrador | |
|---|
| Nova Scotia |
- Cape Breton—Canso
- Central Nova
- Cumberland—Colchester
- Dartmouth—Cole Harbour
- Halifax
- Halifax West
- Kings—Hants
- Sackville—Preston—Chezzetcook
- South Shore—St. Margarets
- Sydney—Victoria
- West Nova
|
|---|
| Prince Edward Island | |
|---|
| New Brunswick |
- Acadie—Bathurst
- Beauséjour
- Fredericton
- Fundy Royal
- Madawaska—Restigouche
- Miramichi—Grand Lake
- Moncton—Riverview—Dieppe
- New Brunswick Southwest
- Saint John—Rothesay
- Tobique—Mactaquac
|
|---|
Текст в блоке "Читать" взят с сайта "Википедия" и доступен по лицензии Creative Commons Attribution-ShareAlike; в отдельных случаях могут действовать дополнительные условия.
Другой контент может иметь иную лицензию. Перед использованием материалов сайта WikiSort.org внимательно изучите правила лицензирования конкретных элементов наполнения сайта.
2019-2026
WikiSort.org - проект по пересортировке и дополнению контента Википедии
