world.wikisort.org - Canada
Saint-Valentin (French pronunciation: [sɛ̃ valɑ̃tɛ̃]) is a municipality in southern Quebec, Canada located in the administrative area of the Montérégie. The population as of the Canada 2011 Census was 470.
Saint-Valentin | |
|---|---|
Municipality | |
 | |
 Coat of arms | |
| Motto(s): Faire que devra | |
 Location within Le Haut-Richelieu RCM | |
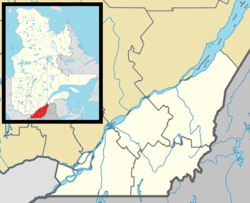 Saint-Valentin Location in southern Quebec | |
| Coordinates: 45°08′N 73°19′W[1] | |
| Country | |
| Province | |
| Region | Montérégie |
| RCM | Le Haut-Richelieu |
| Constituted | July 1, 1855 |
| Government | |
| • Mayor | Pierre Chamberland |
| • Federal riding | Saint-Jean |
| • Prov. riding | Huntingdon |
| Area | |
| • Total | 39.50 km2 (15.25 sq mi) |
| • Land | 39.56 km2 (15.27 sq mi) |
| There is an apparent contradiction between two authoritative sources | |
| Population (2011)[4] | |
| • Total | 470 |
| • Density | 11.9/km2 (31/sq mi) |
| • Pop 2006-2011 | |
| • Dwellings | 173 |
| Time zone | UTC−5 (EST) |
| • Summer (DST) | UTC−4 (EDT) |
| Postal code(s) | J0J 2E0 |
| Area code(s) | 450 and 579 |
| Highways | |
| Website | www.municipalite. saint-valentin.qc.ca |
Named after the Christian hallow Saint Valentine, the community has lately[when?] been trying to capitalize on its name as a destination for lovers. A Festival de la Saint-Valentin is held every February, along with a St. Valentine's Day Mass. The post office frequently receives letters from around the world to postmark.[5]
Demographics
Population
Canada census – Saint-Valentin community profile
| 2021 | 2011 | |
|---|---|---|
| Population | 418 (-6.5% from 2016) | 470 (-1.7% from 2006) |
| Land area | 39.27 km2 (15.16 sq mi) | 39.56 km2 (15.27 sq mi) |
| Population density | 10.6/km2 (27/sq mi) | 11.9/km2 (31/sq mi) |
| Median age | 43.6 (M: 44.8, F: 42.4) | 39.3 (M: 42.8, F: 34.5) |
| Total private dwellings | 160 | 173 |
| Median household income | $58,180 |
|
|
|
Language
| Canada Census Mother Tongue - Saint-Valentin, Quebec[9] | ||||||||||||||||||
|---|---|---|---|---|---|---|---|---|---|---|---|---|---|---|---|---|---|---|
| Census | Total | French |
English |
French & English |
Other | |||||||||||||
| Year | Responses | Count | Trend | Pop % | Count | Trend | Pop % | Count | Trend | Pop % | Count | Trend | Pop % | |||||
2011 |
460 |
425 | 92.39% | 10 | 2.17% | 5 | 1.09% | 20 | 4.35% | |||||||||
2006 |
510 |
480 | 94.12% | 10 | 1.96% | 10 | 1.96% | 10 | 1.96% | |||||||||
2001 |
480 |
440 | 91.67% | 25 | 5.21% | 0 | 0.00% | 15 | 3.12% | |||||||||
1996 |
495 |
435 | n/a | 87.88% | 0 | n/a | 0.00% | 10 | n/a | 2.02% | 50 | n/a | 10.10% | |||||
Education
This section needs expansion. You can help by adding to it. (November 2014) |
The South Shore Protestant Regional School Board previously served the municipality.[10]
See also
- List of municipalities in Quebec
References
Wikimedia Commons has media related to Saint-Valentin, Quebec.
- "Reference number 402076 in Banque de noms de lieux du Québec". toponymie.gouv.qc.ca (in French). Commission de toponymie du Québec.
- Ministère des Affaires municipales, des Régions et de l'Occupation du territoire: Saint-Valentin
- Parliament of Canada Federal Riding History: Saint-Jean (Quebec)
- "2011 Community Profiles". 2011 Canadian Census. Statistics Canada. March 21, 2019. Retrieved 2014-04-06.
- Peretz, Ingrid. "Saint-Valentin, Que., has its heart set on becoming the capital of love." The Globe and Mail. February 11, 2011.
- "2021 Community Profiles". 2021 Canadian Census. Statistics Canada. February 4, 2022. Retrieved 2022-04-27.
- "2006 Community Profiles". 2006 Canadian Census. Statistics Canada. August 20, 2019.
- "2001 Community Profiles". 2001 Canadian Census. Statistics Canada. July 18, 2021.
- Statistics Canada: 1996, 2001, 2006, 2011 census
- King, M.J. (Chairperson of the board). "South Shore Protestant Regional School Board" (St. Johns, PQ). The News and Eastern Townships Advocate. Volume 119, No. 5. Thursday December 16, 1965. p. 2. Retrieved from Google News on November 23, 2014.
Adjacent Municipal Subdivisions | ||||||||||||||||
|---|---|---|---|---|---|---|---|---|---|---|---|---|---|---|---|---|
| ||||||||||||||||
| Cities & Towns |
|
|---|---|
| Municipalities |
|
| Parishes | |
| |
Authority control | |
|---|---|
| General | |
| National libraries | |
Текст в блоке "Читать" взят с сайта "Википедия" и доступен по лицензии Creative Commons Attribution-ShareAlike; в отдельных случаях могут действовать дополнительные условия.
Другой контент может иметь иную лицензию. Перед использованием материалов сайта WikiSort.org внимательно изучите правила лицензирования конкретных элементов наполнения сайта.
Другой контент может иметь иную лицензию. Перед использованием материалов сайта WikiSort.org внимательно изучите правила лицензирования конкретных элементов наполнения сайта.
2019-2026
WikiSort.org - проект по пересортировке и дополнению контента Википедии
WikiSort.org - проект по пересортировке и дополнению контента Википедии