world.wikisort.org - Canada
LaSalle—Émard—Verdun is a federal electoral district in Montreal, Quebec. It was created by the 2012 federal electoral boundaries redistribution and was legally defined in the 2013 representation order. It came into effect upon the call of the 42nd Canadian federal election, scheduled for 19 October 2015.[2] It was created out of parts of Jeanne-Le Ber (51%) and LaSalle—Émard (49%) plus a small section of territory between the Lachine Canal and the Le Sud-Ouest borough boundary taken from Westmount—Ville-Marie and an adjacent uninhabited section from Notre-Dame-de-Grâce—Lachine.[3][4]
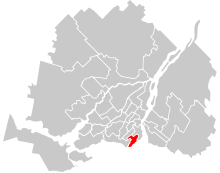 LaSalle—Émard—Verdun in relation to other federal electoral districts in Montreal and Laval | |||
| Federal electoral district | |||
| Legislature | House of Commons | ||
| MP |
Liberal | ||
| District created | 2013 | ||
| First contested | 2015 | ||
| Last contested | 2021 | ||
| District webpage | profile, map | ||
| Demographics | |||
| Population (2016)[1] | 106,766 | ||
| Electors (2019) | 82,321 | ||
| Area (km²)[1] | 19 | ||
| Pop. density (per km²) | 5,619.3 | ||
| Census division(s) | Montreal | ||
| Census subdivision(s) | Montreal | ||
The riding was originally intended to be named LaSalle—Verdun.[5]
The former Member of Parliament for the LaSalle—Émard riding, Hélène Leblanc, sought reelection in the new riding for the NDP.[6]
Geography
The riding includes the borough of Verdun (excluding Nuns' Island), part of the borough of LaSalle, along with the neighbourhoods of Ville-Émard and Côte-Saint-Paul in the Le Sud-Ouest borough.
Demographics
- According to the Canada 2016 Census
- Languages (2016 mother tongue) : 58.8% French, 18.9% English, 3.3% Spanish, 3.1% Mandarin, 2.7% Italian, 1.8% Arabic, 1.4% Russian, 0.8% Cantonese, 0.8% Bengali, 0.7% Romanian, 0.6% Polish, 0.6% Portuguese, 0.5% Vietnamese, 0.4% Bulgarian, 0.4% Greek, 0.4% Albanian[7]
Members of Parliament
This riding has elected the following Members of Parliament:
| Parliament | Years | Member | Party | |
|---|---|---|---|---|
| LaSalle—Émard—Verdun Riding created from Jeanne-Le Ber, LaSalle—Émard, Notre-Dame-de-Grâce—Lachine and Westmount—Ville-Marie |
||||
| 42nd | 2015–2019 | David Lametti | Liberal | |
| 43rd | 2019–2021 | |||
| 44th | 2021–present | |||
Election results
| 2021 Canadian federal election | ||||||||
|---|---|---|---|---|---|---|---|---|
| Party | Candidate | Votes | % | ±% | Expenditures | |||
| Liberal | David Lametti | 20,330 | 42.9 | -0.6 | ||||
| Bloc Québécois | Raphaël Guérard | 10,461 | 22.1 | -3.0 | ||||
| New Democratic | Jason De Lierre | 9,168 | 19.4 | +2.9 | ||||
| Conservative | Janina Moran | 3,530 | 7.5 | +0.5 | ||||
| People's | Michel Walsh | 1,600 | 3.4 | +2.5 | ||||
| Green | Sarah Carter | 1,439 | 3.0 | -3.8 | ||||
| Free | Pascal Antonin | 636 | 1.3 | N/A | ||||
| Communist | J.P. Fortin | 196 | 0.4 | N/A | ||||
| Total valid votes | 47,360 | 97.9 | ||||||
| Total rejected ballots | 1,036 | 2.1 | ||||||
| Turnout | 48,396 | 60.8 | ||||||
| Registered voters | 79,625 | |||||||
| Liberal hold | Swing | +1.2 | ||||||
| Source: Elections Canada[8] | ||||||||
| 2019 Canadian federal election | ||||||||
|---|---|---|---|---|---|---|---|---|
| Party | Candidate | Votes | % | ±% | Expenditures | |||
| Liberal | David Lametti | 22,803 | 43.5 | -0.4 | $80,672.35 | |||
| Bloc Québécois | Isabel Dion | 12,619 | 24.1 | +7.05 | none listed | |||
| New Democratic | Steven Scott | 8,628 | 16.5 | -12.45 | $15,273.80 | |||
| Conservative | Claudio Rocchi | 3,690 | 7.0 | +0.09 | none listed | |||
| Green | Jency Mercier | 3,583 | 6.8 | +3.61 | none listed | |||
| People's | Daniel Turgeon | 490 | 0.9 | – | none listed | |||
| No affiliation | Julien Côté | 274 | 0.5 | – | $3,639.71 | |||
| Rhinoceros | Rhino Jacques Bélanger | 265 | 0.5 | – | $0.00 | |||
| Marxist–Leninist | Eileen Studd | 39 | 0.1 | – | $0.00 | |||
| Total valid votes/expense limit | 52,391 | 100.0 | ||||||
| Total rejected ballots | 864 | |||||||
| Turnout | 53,255 | 64.7 | ||||||
| Eligible voters | 82,321 | |||||||
| Liberal hold | Swing | -7.45 | ||||||
| Source: Elections Canada[9][10] | ||||||||
| 2015 Canadian federal election | ||||||||
|---|---|---|---|---|---|---|---|---|
| Party | Candidate | Votes | % | ±% | Expenditures | |||
| Liberal | David Lametti | 23,603 | 43.90 | +25.60 | $93,016.24 | |||
| New Democratic | Hélène LeBlanc | 15,566 | 28.95 | -16.22 | $46,314.39 | |||
| Bloc Québécois | Gilbert Paquette | 9,164 | 17.05 | -6.39 | $43,806.34 | |||
| Conservative | Mohammad Zamir | 3,713 | 6.91 | -2.83 | – | |||
| Green | Lorraine Banville | 1,717 | 3.19 | +0.63 | – | |||
| Total valid votes/Expense limit | 53,763 | 100.00 | $221,667.78 | |||||
| Total rejected ballots | 823 | 1.51 | – | |||||
| Turnout | 54,586 | 65.12 | – | |||||
| Eligible voters | 83,824 | |||||||
| Source: Elections Canada[11][12] | ||||||||
| 2011 federal election redistributed results[13] | |||
|---|---|---|---|
| Party | Vote | % | |
| New Democratic | 22,071 | 45.17 | |
| Bloc Québécois | 11,453 | 23.44 | |
| Liberal | 8,940 | 18.30 | |
| Conservative | 4,760 | 9.74 | |
| Green | 1,249 | 2.56 | |
| Others | 391 | 0.80 | |
References
- Statistics Canada: 2016
- Timeline for the Redistribution of Federal Electoral Districts
- Final Report – Quebec
- "LaSalle–Émard–Verdun".
- "Government Bill (House of Commons) C-37 (41-2) - Third Reading - Riding Name Change Act, 2014 - Parliament of Canada".
- "Le Messager Verdun SmartEdition".
- "Mother Tongue (269), Knowledge of Official Languages (5), Age (15A) and Sex (3) for the Population Excluding Institutional Residents of Canada, Provinces and Territories and Federal Electoral Districts (2013 Representation Order), 2016 Census - 100% Data". August 2, 2017.
- "Confirmed candidates — LaSalle—Émard—Verdun". Elections Canada. Retrieved September 20, 2021.
- "List of confirmed candidates". Elections Canada. Retrieved October 3, 2019.
- "Election Night Results". Elections Canada. Retrieved November 11, 2019.
- Elections Canada – Confirmed candidates for LaSalle—Émard—Verdun, 30 September 2015
- Elections Canada – Preliminary Election Expenses Limits for Candidates Archived 2015-08-15 at the Wayback Machine
- Pundits' Guide to Canadian Elections
This article about a Canadian electoral district is a stub. You can help Wikipedia by expanding it. |
Другой контент может иметь иную лицензию. Перед использованием материалов сайта WikiSort.org внимательно изучите правила лицензирования конкретных элементов наполнения сайта.
WikiSort.org - проект по пересортировке и дополнению контента Википедии