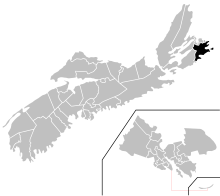
world.wikisort.org - CanadaCape Breton East (formerly Sydney River-Mira-Louisbourg) is a provincial electoral district in Nova Scotia, Canada, that elects one member of the Nova Scotia House of Assembly. The riding is represented by Brian Comer of the Progressive Conservative Party.[1]
For the former district of Cape Breton East (1933-2001), see Glace Bay-Dominion.
Provincial electoral district in Nova Scotia, Canada
Cape Breton East Nova Scotia electoral district Nova Scotia electoral district |
|---|
 |
|
| Legislature | Nova Scotia House of Assembly |
|---|
| MLA | Brian Comer
Progressive Conservative |
|---|
| District created | 1933 |
|---|
| First contested | 1933 |
|---|
| Last contested | 2021 |
|---|
|
| Electors | 15,098 |
|---|
| Area (km²) | 1,093 |
|---|
| Census division(s) | Cape Breton County |
|---|
| Census subdivision(s) | Cape Breton Regional Municipality |
|---|
In 1925, the County of Cape Breton and neighbouring Richmond County were divided into three distinct electoral districts, one of which was named Richmond-West Cape Breton. In 1933, on the recommendations of the 1932 Electoral Boundaries Commission, Richmond-West Cape Breton was dissolved and two new districts were created, one of which was Cape Breton West, which also took in parts of Cape Breton Centre and Cape Breton East.[2][3] In 2003, this district had minor adjustments to its boundaries with Cape Breton South, Cape Breton Centre, and Glace Bay. It gained the area on the north side of East Bay along highway 216 to include Eskasoni First Nation. In 2013, following the recommendations of the 2012 Electoral Boundaries Commission, the district was renamed Sydney River-Mira-Louisbourg. It gained the Mira Road, Sydney River, Prime Brook, and Coxheath areas from Cape Breton South, as well as a section of Grand Lake Road from Cape Breton Nova. It lost the area northwest of East Bay to Victoria-The Lakes and the area southwest of Portage and Sandfield and west of the Mira River to Cape Breton-Richmond.[4]
The riding was renamed Cape Breton East for the 2021 Nova Scotia general election.
Members of the Legislative Assembly
This riding has elected the following Members of the Legislative Assembly:
| Legislature |
Years |
Member |
Party |
| Cape Breton East |
| 64th |
2021-Present |
|
Brian Comer |
Progressive Conservative |
| Sydney River-Mira-Louisbourg |
| 63rd |
2019–2021 |
|
Brian Comer |
Progressive Conservative |
| 2017–2019 |
Alfie MacLeod |
| 62nd |
2013–2017 |
| Cape Breton West |
| 61st |
2009–2013 |
|
Alfie MacLeod |
Progressive Conservative |
| 60th |
2006-2009 |
| 59th |
2005-2006 |
|
Russell MacKinnon |
Independent |
| 2003-2005 |
|
Liberal |
| 58th |
1999-2003 |
| 57th |
1998-1999 |
| 56th |
1995-1998 |
|
Alfie MacLeod |
Progressive Conservative |
| 1993-1995 |
|
Russell MacKinnon |
Liberal |
| 55th |
1988-1993 |
| 54th |
1984-1988 |
|
Donnie MacLeod |
Progressive Conservative |
| 53rd |
1981-1984 |
| 52nd |
1978-1981 |
|
David Muise |
Liberal |
| 51st |
1976-1978 |
|
Osborne Fraser |
Liberal |
| 1974-1976 |
|
Allan Sullivan |
Liberal |
| 50th |
1970-1974 |
| 49th |
1967-1970 |
|
Edward Manson |
Progressive Conservative |
| 48th |
1963-1967 |
| 47th |
1960-1963 |
| 46th |
1956-1960 |
| 45th |
1953-1956 |
|
Malcolm A. Patterson |
Liberal |
| 44th |
1949-1953 |
| 43rd |
1945-1949 |
| 42nd |
1941-1945 |
| 41st |
1937-1941 |
| 40th |
1933-1937 |
|
Weldon W. Patton |
Conservative |
Election results
Cape Breton East
| 2021 Nova Scotia general election |
| Party |
Candidate |
Votes | % | |
|
Progressive Conservative | Brian Comer | 3,897 | 46.27 | +2.54 |
|
Liberal | Heather Peters | 3,094 | 36.73 | +5.36 |
|
New Democratic | Barbara Beaton | 1,432 | 17.00 | +9.32 |
| Total valid votes |
8,423 | 99.37 |
| Total rejected ballots |
53 | 0.63 |
| Turnout |
8,476 | 61.42 |
| Eligible voters |
13,801 |
|
Progressive Conservative hold |
Swing |
-1.41 |
| Source: Elections Nova Scotia[5] |
Sydney River-Mira-Louisbourg
Nova Scotia provincial by-election, September 3, 2019[6]
Upon the resignation of Alfie MacLeod |
| Party |
Candidate |
Votes | % | |
|
Progressive Conservative | Brian Comer | 3,215 | 43.73 | -24.00 |
|
Liberal | Marc Botte | 2,306 | 31.37 | +7.75 |
|
Independent | Russ Green | 979 | 13.32 | |
|
New Democratic | Mary Beth MacDonald | 565 | 7.68 | -0.97 |
|
Green | Bill Matheson | 287 | 3.90 | |
| Total valid votes |
7,352 | 99.66 |
| Total rejected ballots |
25 | 0.34 | -0.26 |
| Turnout |
7,377 | 48.86 | -11.90 |
| Eligible voters |
15,098 |
|
Progressive Conservative hold |
Swing |
-15.88 |
| 2017 Nova Scotia general election: Sydney River-Mira-Louisbourg |
| Party |
Candidate |
Votes | % | |
|
Progressive Conservative | Alfie MacLeod | 6,370 | 67.73 | +23.98 |
|
Liberal | Katherine MacDonald | 2,221 | 23.62 | -16.16 |
|
New Democratic | Bill Matheson | 814 | 8.65 | -7.82 |
| Total valid votes |
9,405 | 99.40 | – |
| Total rejected ballots |
57 | 0.60 | -0.17 |
| Turnout |
9,462 | 60.76 | -2.59 |
| Eligible voters |
15,572 |
|
Progressive Conservative hold |
Swing |
+20.07 |
| Source: Elections Nova Scotia[7] |
| 2013 Nova Scotia general election |
| Party |
Candidate |
Votes | % | |
|
Progressive Conservative | Alfie MacLeod | 4,178 | 43.75 | +0.28 |
|
Liberal | Josephine Kennedy | 3,798 | 39.78 | +15.51 |
|
New Democratic | Delton MacDonald | 1,573 | 16.47 | -14.22 |
| Total valid votes |
9,549 | 99.23 | – |
| Total rejected ballots |
74 | 0.77 | – |
| Turnout |
9,623 | 63.35 | +1.76 |
| Eligible voters |
15,190 |
|
Progressive Conservative notional hold |
Swing |
+7.90
|
| Source: Elections Nova Scotia[7] |
Cape Breton West
| 2009 Nova Scotia general election |
| Party |
Candidate |
Votes | % | |
|
Progressive Conservative | Alfie MacLeod | 3,962 | 43.47 | -10.29 |
|
New Democratic | Delton MacDonald | 2,797 | 30.69 | +15.41 |
|
Liberal | Josephine Kennedy | 2,212 | 24.27 | -4.01 |
|
Green | Mike Parsons | 143 | 1.57 | -1.11 |
| Total valid votes |
9,114 | 99.70 | – |
| Total rejected ballots |
27 | 0.30 | – |
| Turnout |
9,141 | 61.59 | -0.54 |
| Eligible voters |
14,843 |
|
Progressive Conservative hold |
Swing |
-12.85 |
| Source: Elections Nova Scotia[7] |
| 2006 Nova Scotia general election |
| Party |
Candidate |
Votes | % | |
|
Progressive Conservative | Alfie MacLeod | 4,729 | 53.76 | +28.33 |
|
Liberal | Dave LeBlanc | 2,488 | 28.28 | -24.56 |
|
New Democratic | Terry Crawley | 1,344 | 15.28 | -6.45 |
|
Green | Michael P. Milburn | 236 | 2.68 | +2.68 |
| Total valid votes |
8,797 | 99.61 | – |
| Total rejected ballots |
34 | 0.39 | – |
| Turnout |
8,831 | 62.13 | -5.36 |
| Eligible voters |
14,215 |
|
Progressive Conservative gain from Liberal |
Swing |
+26.45 |
| Source: Elections Nova Scotia[7] |
| 2003 Nova Scotia general election |
| Party |
Candidate |
Votes | % | |
|
Liberal | Russell MacKinnon | 4,616 | 52.84 | +1.01 |
|
Progressive Conservative | Ivan Doncaster | 2,221 | 25.43 | +11.44 |
|
New Democratic | Douglas MacKinlay | 1,898 | 21.73 | -12.45 |
| Total valid votes |
8,735 | 99.50 | – |
| Total rejected ballots |
44 | 0.50 | – |
| Turnout |
8,779 | 67.49 | -11.46 |
| Eligible voters |
13,007 |
|
Liberal hold |
Swing |
+6.23 |
| Source: Elections Nova Scotia[7] |
| 1999 Nova Scotia general election |
| Party |
Candidate |
Votes | % | |
|
Liberal | Russell MacKinnon | 5,094 | 51.83 | +7.78 |
|
New Democratic | Brian Slaney | 3,359 | 34.18 | +5.65 |
|
Progressive Conservative | Joe Boudreau | 1,375 | 13.99 | -13.43 |
| Total valid votes |
9,828 | 99.34 | – |
| Total rejected ballots |
65 | 0.66 | – |
| Turnout |
9,893 | 78.95 | -0.92 |
| Eligible voters |
12,531 |
|
Liberal hold |
Swing |
+6.72 |
| Source: Elections Nova Scotia[7] |
| 1998 Nova Scotia general election |
| Party |
Candidate |
Votes | % | |
|
Liberal | Russell MacKinnon | 4,528 | 44.05 | +10.71 |
|
New Democratic | Brian Slaney | 2,933 | 28.53 | -1.95 |
|
Progressive Conservative | Alfie MacLeod | 2,818 | 27.42 | -8.76 |
| Total valid votes |
10,279 | 99.58 | – |
| Total rejected ballots |
43 | 0.42 | – |
| Turnout |
10,322 | 79.87 | +15.34 |
| Eligible voters |
12,924 |
|
Liberal gain from Progressive Conservative |
Swing |
+6.33 |
| Source: Elections Nova Scotia[7] |
Nova Scotia provincial by-election, October 10, 1995
upon the resignation of Russell MacKinnon |
| Party |
Candidate |
Votes | % | |
|
Progressive Conservative | Alfie MacLeod | 2,824 | 36.18 | +16.62 |
|
Liberal | Gerry Delaney | 2,603 | 33.34 | -36.67 |
|
New Democratic | Brian Slaney | 2,379 | 30.48 | +23.08 |
| Total valid votes |
7,806 | 99.33 | – |
| Total rejected ballots |
53 | 0.67 | – |
| Turnout |
7,859 | 64.53 | -17.96 |
| Eligible voters |
12,179 |
|
Progressive Conservative gain from Liberal |
Swing |
+26.65 |
| Source: Elections Nova Scotia[8] |
| 1993 Nova Scotia general election |
| Party |
Candidate |
Votes | % | |
|
Liberal | Russell MacKinnon | 7,355 | 70.01 | +15.70 |
|
Progressive Conservative | Victor Hanham | 2,055 | 19.56 | -16.31 |
|
New Democratic | Daniel O'Connor | 777 | 7.40 | -2.42 |
|
Independent | Wendy MacKenzie | 318 | 3.03 | +3.03 |
| Total valid votes |
10,505 | 99.51 | – |
| Total rejected ballots |
52 | 0.49 | – |
| Turnout |
10,557 | 82.49 | -0.16 |
| Eligible voters |
12,798 |
|
Liberal hold |
Swing |
+16.01 |
| Source: Elections Nova Scotia[7] |
| 1988 Nova Scotia general election |
| Party |
Candidate |
Votes | % | |
|
Liberal | Russell MacKinnon | 6,133 | 54.31 | +14.27 |
|
Progressive Conservative | Donald Archie MacLeod | 4,050 | 35.87 | -15.49 |
|
New Democratic | Con Mills | 1,109 | 9.82 | +3.88 |
| Total valid votes |
11,292 | 99.41 | – |
| Total rejected ballots |
67 | 0.59 | – |
| Turnout |
11,359 | 82.65 | +9.37 |
| Eligible voters |
13,743 |
|
Liberal gain from Progressive Conservative |
Swing |
+14.88 |
| Source: Elections Nova Scotia[7] |
| 1984 Nova Scotia general election |
| Party |
Candidate |
Votes | % | |
|
Progressive Conservative | Donald Archie MacLeod | 5,035 | 51.36 | +8.77 |
|
Liberal | Russell MacKinnon | 3,925 | 40.04 | +1.48 |
|
New Democratic | Terry Crawley | 582 | 5.94 | -12.91 |
|
Cape Breton Labour | Linda Martin | 261 | 2.66 | +2.66 |
| Total valid votes |
9,803 | 99.50 | – |
| Total rejected ballots |
49 | 0.50 | – |
| Turnout |
9,852 | 73.28 | -4.00 |
| Eligible voters |
13,444 |
|
Progressive Conservative hold |
Swing |
+5.13 |
| Source: Elections Nova Scotia[7] |
| 1981 Nova Scotia general election |
| Party |
Candidate |
Votes | % | |
|
Progressive Conservative | Donald Archie MacLeod | 4,125 | 42.59 | +11.64 |
|
Liberal | David Muise | 3,735 | 38.56 | +1.76 |
|
New Democratic | Elizabeth Cusack Walsh | 1,826 | 18.85 | -12.10 |
| Total valid votes |
9,686 | 99.11 | – |
| Total rejected ballots |
87 | 0.89 | – |
| Turnout |
9,773 | 77.28 | -6.30 |
| Eligible voters |
12,647 |
|
Progressive Conservative gain from Liberal |
Swing |
+6.70 |
| Source: Elections Nova Scotia[7] |
| 1978 Nova Scotia general election |
| Party |
Candidate |
Votes | % | |
|
Liberal | David Muise | 3,664 | 36.80 | +1.06 |
|
New Democratic | Frank Boone | 3,211 | 32.25 | -1.00 |
|
Progressive Conservative | Donald Archie MacLeod | 3,081 | 30.95 | -0.06 |
| Total valid votes |
9,956 | 99.36 | – |
| Total rejected ballots |
64 | 0.64 | – |
| Turnout |
10,020 | 83.58 | +5.43 |
| Eligible voters |
11,988 |
|
Liberal hold |
Swing |
+1.03 |
| Source: Elections Nova Scotia[7] |
Nova Scotia provincial by-election, September 7, 1976
upon the resignation of Allan Sullivan |
| Party |
Candidate |
Votes | % | |
|
Liberal | Osborne Fraser | 4,236 | 35.74 | -17.72 |
|
New Democratic | Frank Boone | 3,940 | 33.25 | +13.94 |
|
Progressive Conservative | James MacDonald | 3,675 | 31.01 | +3.78 |
| Total valid votes |
11,851 | 98.68 | – |
| Total rejected ballots |
158 | 1.32 | – |
| Turnout |
12,009 | 78.15 | -3.59 |
| Eligible voters |
15,366 |
|
Liberal hold |
Swing |
-15.83 |
| Source: Elections Nova Scotia[9] |
| 1974 Nova Scotia general election |
| Party |
Candidate |
Votes | % | |
|
Liberal | Allan Sullivan | 6,281 | 53.46 | +2.54 |
|
Progressive Conservative | Kenneth Andrews | 3,199 | 27.23 | -21.85 |
|
New Democratic | Frank Boone | 2,269 | 19.31 | +19.31 |
| Total valid votes |
11,749 | 99.03 | – |
| Total rejected ballots |
115 | 0.97 | – |
| Turnout |
11,864 | 81.74 | +3.55 |
| Eligible voters |
14,515 |
|
Liberal hold |
Swing |
+12.20 |
| Source: Elections Nova Scotia[7] |
| 1970 Nova Scotia general election |
| Party |
Candidate |
Votes | % | |
|
Liberal | Allan Sullivan | 5,024 | 50.92 | +8.27 |
|
Progressive Conservative | Kenneth Andrews | 4,843 | 49.08 | +5.13 |
| Total valid votes |
9,867 | 98.84 | – |
| Total rejected ballots |
116 | 1.16 | – |
| Turnout |
9,983 | 78.19 | -1.58 |
| Eligible voters |
12,768 |
|
Liberal gain from Progressive Conservative |
Swing |
+6.70 |
| Source: Elections Nova Scotia[7] |
| 1967 Nova Scotia general election |
| Party |
Candidate |
Votes | % | |
|
Progressive Conservative | Edward Manson | 3,862 | 43.95 | -12.35 |
|
Liberal | Allan Sullivan | 3,748 | 42.65 | -1.05 |
|
New Democratic | Jeremy Akerman | 1,178 | 13.40 | +13.40 |
| Total valid votes |
8,788 | 99.39 | – |
| Total rejected ballots |
54 | 0.61 | – |
| Turnout |
8,842 | 79.77 | -0.32 |
| Eligible voters |
11,084 |
|
Progressive Conservative hold |
Swing |
-6.70 |
| Source: Elections Nova Scotia[7] |
| 1963 Nova Scotia general election |
| Party |
Candidate |
Votes | % | |
|
Progressive Conservative | Edward Manson | 4,941 | 56.30 | +10.93 |
|
Liberal | Allan Sullivan | 3,835 | 43.70 | +4.17 |
| Total valid votes |
8,776 | 99.31 | – |
| Total rejected ballots |
61 | 0.69 | – |
| Turnout |
8,837 | 80.09 | -8.71 |
| Eligible voters |
11,034 |
|
Progressive Conservative hold |
Swing |
+7.55 |
| Source: Elections Nova Scotia[7] |
| 1960 Nova Scotia general election |
| Party |
Candidate |
Votes | % | |
|
Progressive Conservative | Edward Manson | 4,192 | 45.37 | -6.60 |
|
Liberal | Herbert Shannon | 3,652 | 39.53 | -8.50 |
|
Co-operative Commonwealth | John R. Lynk | 1,395 | 15.10 | +15.10 |
| Total valid votes |
9,239 | 99.48 | – |
| Total rejected ballots |
48 | 0.52 | – |
| Turnout |
9,287 | 88.80 | +1.53 |
| Eligible voters |
10,458 |
|
Progressive Conservative hold |
Swing |
-7.55 |
| Source: Elections Nova Scotia[7] |
| 1956 Nova Scotia general election |
| Party |
Candidate |
Votes | % | |
|
Progressive Conservative | Edward Manson | 4,440 | 51.97 | +18.41 |
|
Liberal | Malcolm Alexander Patterson | 4,104 | 48.03 | -0.83 |
| Total valid votes |
8,544 | 99.26 | – |
| Total rejected ballots |
64 | 0.74 | – |
| Turnout |
8,608 | 87.27 | +2.07 |
| Eligible voters |
9,864 |
|
Progressive Conservative gain from Liberal |
Swing |
+9.62 |
| Source: Elections Nova Scotia[7] |
| 1953 Nova Scotia general election |
| Party |
Candidate |
Votes | % | |
|
Liberal | Malcolm Alexander Patterson | 3,730 | 48.86 | -2.27 |
|
Progressive Conservative | Edward Manson | 2,562 | 33.56 | +2.08 |
|
Co-operative Commonwealth | Harry Munroe | 1,342 | 17.58 | +0.19 |
| Total valid votes |
7,634 | 99.76 | – |
| Total rejected ballots |
18 | 0.24 | – |
| Turnout |
7,652 | 85.20 | +3.85 |
| Eligible voters |
8,981 |
|
Liberal hold |
Swing |
-2.18 |
| Source: Elections Nova Scotia[7] |
| 1949 Nova Scotia general election |
| Party |
Candidate |
Votes | % | |
|
Liberal | Malcolm Alexander Patterson | 3,444 | 51.13 | +1.31 |
|
Progressive Conservative | David R. MacLeod | 2,120 | 31.48 | +13.81 |
|
Co-operative Commonwealth | Arthur Briggs | 1,171 | 17.39 | -15.12 |
| Total valid votes |
6,735 | 99.23 | – |
| Total rejected ballots |
53 | 0.77 | – |
| Turnout |
6,787 | 81.35 | +9.99 |
| Eligible voters |
8,343 |
|
Liberal hold |
Swing |
+7.56 |
| Source: Elections Nova Scotia[7] |
| 1945 Nova Scotia general election |
| Party |
Candidate |
Votes | % | |
|
Liberal | Malcolm Alexander Patterson | 2,826 | 49.82 | +8.72 |
|
Co-operative Commonwealth | Robert Joseph Orr | 1,844 | 32.51 | +5.10 |
|
Progressive Conservative | Horace L. Ferguson | 1,002 | 17.67 | -13.32 |
| Total valid votes |
5,672 | 99.60 | – |
| Total rejected ballots |
23 | 0.40 | – |
| Turnout |
5,695 | 71.36 | -3.59 |
| Eligible voters |
7,981 |
|
Liberal hold |
Swing |
+6.91 |
| Source: Elections Nova Scotia[7] |
| 1941 Nova Scotia general election |
| Party |
Candidate |
Votes | % | |
|
Liberal | Malcolm Alexander Patterson | 2,306 | 41.10 | -9.70 |
|
Progressive Conservative | Joseph Alexander MacDonald | 1,767 | 31.49 | -17.71 |
|
Co-operative Commonwealth | Robert Joseph Orr | 1,538 | 27.41 | +27.41 |
| Total valid votes |
5,611 | 99.24 | – |
| Total rejected ballots |
43 | 0.76 | – |
| Turnout |
5,654 | 74.95 | -4.07 |
| Eligible voters |
7,544 |
|
Liberal hold |
Swing |
-13.71 |
| Source: Elections Nova Scotia[7] |
| 1937 Nova Scotia general election |
| Party |
Candidate |
Votes | % | |
|
Liberal | Malcolm Alexander Patterson | 2,883 | 50.80 | +4.29 |
|
Progressive Conservative | Evan Forbes | 2,792 | 49.20 | -4.29 |
| Total valid votes |
5,675 | 99.40 | – |
| Total rejected ballots |
34 | 0.60 | – |
| Turnout |
5,709 | 79.02 | -0.13 |
| Eligible voters |
7,225 |
|
Liberal gain from Progressive Conservative |
Swing |
+4.29 |
| Source: Elections Nova Scotia[7] |
| 1933 Nova Scotia general election |
| Party |
Candidate |
Votes | % | |
|
Progressive Conservative | Weldon W. Patton | 3,036 | 53.49 | – |
|
Liberal | Alonzo Archibald Martell | 2,640 | 46.51 | – |
| Total valid votes |
5,676 | 99.63 | – |
| Total rejected ballots |
21 | 0.37 | – |
| Turnout |
5,697 | 79.15 | – |
| Eligible voters |
7,198 |
|
Progressive Conservative notional gain from Liberal |
Swing |
– |
| Source: Elections Nova Scotia[7] |
References
- "MacLeod takes Sydney River-Mira-Louisbourg" Cape Breton Post, October 8, 2013.
- "Electoral History for Richmond-West Cape Breton" (PDF). Nova Scotia Legislature. October 30, 2013. Retrieved April 5, 2019.
- "Electoral History for Cape Breton County" (PDF). Nova Scotia Legislature. October 30, 2013. Retrieved April 5, 2019.
- "Electoral History for Sydney River-Mira-Louisbourg" (PDF). Nova Scotia Legislature. October 30, 2013. Retrieved April 5, 2019.
- "Provincial General Election 2021-08-17- Official Results". Elections Nova Scotia. Retrieved October 7, 2021.
- Gorman, Michael (August 2, 2019). "Premier calls byelections to fill 3 vacancies". CBC Nova Scotia. Retrieved August 3, 2019.
- "Summary Results of Nova Scotia Elections, 1867 - 2017" (PDF). Elections Nova Scotia. June 4, 2018. Retrieved August 2, 2019.
- "Return of By-Election for the House of Assembly, 1995, Electoral District of Cape Breton West" (PDF). Elections Nova Scotia. Retrieved August 8, 2019.
- "Return of By-Election for the House of Assembly, 1976, Electoral District of Cape Breton West" (PDF). Elections Nova Scotia. Retrieved August 8, 2019.
External links
Nova Scotia provincial electoral districts |
|---|
| Current | |
|---|
| Historic | | to 2021: | |
|---|
| to 2013: |
- Argyle
- Cape Breton North
- Cape Breton Nova
- Cape Breton South
- Cape Breton West
- Clare
- Cole Harbour
- Dartmouth South-Portland Valley
- Digby-Annapolis
- Guysborough-Sheet Harbour
- Halifax Clayton Park
- Halifax Fairview
- Hammonds Plains-Upper Sackville
- Preston
- Queens
- Richmond
- Shelburne
- Truro-Bible Hill
|
|---|
| to 2003: |
- Bedford-Fall River
- Cape Breton East
- Cape Breton The Lakes
- Dartmouth South
- Dartmouth-Cole Harbour
- Guysborough–Port Hawkesbury
- Halifax Bedford Basin
- Sackville-Beaver Bank
- Victoria
|
|---|
| to 1993: |
- Annapolis East
- Annapolis West
- Colchester South
- Cumberland Centre
- Cumberland East
- Cumberland West
- Digby
- Guysborough
- Halifax Cornwallis
- Halifax Eastern Shore
- Halifax St. Margarets
- Inverness North
- Inverness South
- Lunenburg Centre
- Lunenburg East
- Sackville
|
|---|
| to 1978: |
- Colchester
- Halifax Cobequid
|
|---|
| to 1967: |
- Halifax Centre
- Halifax County Dartmouth
- Halifax East
- Halifax North
- Halifax Northwest
- Halifax South
- Halifax West
|
|---|
| to 1956: | |
|---|
| to 1949: | |
|---|
| to 1933: |
- Halifax
- Richmond and Cape Breton West
|
|---|
| to 1925: | |
|---|
|
|---|
- See also: 2021 election
- List of elections
- Politics of Nova Scotia
|
Текст в блоке "Читать" взят с сайта "Википедия" и доступен по лицензии Creative Commons Attribution-ShareAlike; в отдельных случаях могут действовать дополнительные условия.
Другой контент может иметь иную лицензию. Перед использованием материалов сайта WikiSort.org внимательно изучите правила лицензирования конкретных элементов наполнения сайта.
2019-2025
WikiSort.org - проект по пересортировке и дополнению контента Википедии
