world.wikisort.org - Canada
Avalon is a federal electoral district on Newfoundland Island in Newfoundland and Labrador, Canada. It has been represented in the House of Commons of Canada since 2004.
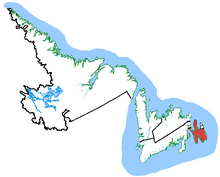 Avalon in relation to other Newfoundland and Labrador ridings (2003 boundaries) | |||
| Federal electoral district | |||
| Legislature | House of Commons | ||
| MP |
Liberal | ||
| District created | 2003 | ||
| First contested | 2004 | ||
| Last contested | 2021 | ||
| District webpage | profile, map | ||
| Demographics | |||
| Population (2016)[1] | 86,494 | ||
| Electors (2019) | 69,131 | ||
| Area (km²)[2] | 6,457.79 | ||
| Pop. density (per km²) | 13.4 | ||
| Census division(s) | Division 1 | ||
| Census subdivision(s) | Admirals Beach, Aquaforte, Avondale, Bay Roberts, Bishop's Cove, Branch, Brigus, Bryant's Cove, Cape Broyle, Carbonear, Clarke's Beach, Colinet, Colliers, Conception Bay South, Conception Harbour, Cupids, Division No. 1, Subd. V, Division No. 1, Subd. W, Division No. 1, Subd. X, Division No. 1, Subd. Y, Fermeuse, Ferryland, Fox Harbour, Gaskiers-Point La Haye, Harbour Grace, Harbour Main-Chapel's Cove-Lakeview, Holyrood, Mount Carmel-Mitchells Brook-St. Catherine's, North River, Paradise, Placentia, Point Lance, Port Kirwan, Portugal Cove South, Renews-Cappahayden, Riverhead, South River, Spaniard's Bay, St. Bride's, St. Joseph's, St. Mary's, St. Shott's, St. Vincent's-St. Stephen's-Peter's River, Subdivision 1A, Subdivision 1B, Subdivision 1C, Subdivision 1D, Subdivision 1E, Subdivision 1F, Subdivision 1G, Subdivision 1H, Subdivision 1I, Subdivision 1J, Subdivision 1K, Subdivision 1L, Subdivision 1M, Subdivision 1N, Subdivision 1O, Subdivision 1U, Treppassey, Upper Island Cove, Victoria | ||
Demographics
- According to the Canada 2011 Census; 2013 representation[3]
Ethnic groups: 97.9% White, 1.5% Aboriginal
Languages: 99.3% English
Religions: 95.7% Christian (43.0% Catholic, 30.2% Anglican, 13.5% United Church, 3.5% Pentecostal, 5.4% Other), 4.1% No religion
Median income (2010): $27,528
Average income (2010): $36,436
Geography
The neighbouring ridings are Random—Burin—St. George's to the west and north, and St. John's South—Mount Pearl and St. John's East to the east.
As of the 2013 Representation Order, the riding of Avalon consists of:[4]
- All that area consisting of that part of the Avalon Peninsula on the Island of Newfoundland lying southerly of a line described as follows:
- commencing at a point in the Eastern Channel at latitude 47°25'49"N and longitude 54°03'34"W;
- thence easterly in a straight line to a point in the Eastern Channel at latitude 47°26'11"N and longitude 53°57'51"W;
- thence southeasterly in a straight line to a point in Long Harbour at latitude 47°24'13"N and longitude 53°55'10"W;
- thence easterly in a straight line to the southwesterly limit of the Town of Long Harbour-Mount Arlington Heights at the mouth of Rattling Brook;
- thence generally westerly, generally northeasterly, generally southeasterly and generally southwesterly along the westerly, southerly, northerly and easterly limits of said town to a point at approximate latitude 47°26'32"N and longitude 53°44'50"W (on the southwesterly shoreline of Warrens Pond);
- thence southeasterly in a straight line to a point at latitude 47°24'44"N and longitude 53°43'54"W;
- thence easterly in a straight line to the southwesternmost point of the limit of the Town of Whitbourne;
- thence generally easterly and northerly along said limit to the northeasternmost point of the limit of said town;
- thence northeasterly in a straight line to the southwesternmost point of the limit of the Town of Spaniard's Bay;
- thence generally northerly along the westerly limit of said town to the northwesternmost point of the limit of said town;
- thence northerly in a straight line to a point in Hound Pond at latitude 47°46'36"N and longitude 53°22'23"W;
- thence northeasterly in a straight line to a point in Broad Cove Gull Pond at latitude 47°49'47"N and longitude 53°12'51"W;
- thence southerly in a straight line to a point on the westerly limit of the Town of Salmon Cove at approximate latitude 47°46'51"N and longitude 53°11'48"W;
- thence generally southerly, northeasterly and northwesterly along the westerly, southerly and easterly limits of said town to a point at approximate latitude 47°47'21"N and longitude 53°08'40"W;
- thence easterly in a straight line to a point in Conception Bay at latitude 47°46'33"N and longitude 52°59'22"W;
- thence generally southerly along Conception Bay to a point at latitude 47°35'58"N and longitude 53°06'22"W;
- thence southeasterly in a straight line to a point in Conception Bay at latitude 47°32'07"N and longitude 53°02'09"W;
- thence southeasterly in a straight line to the northwesterly limit of the Town of Conception Bay South at the mouth of Long Pond Harbour;
- thence northeasterly along the northwesterly limit of said town to the northwesterly limit of the Town of Paradise;
- thence northeasterly along the limit of said town to the northerly limit of said town;
- thence generally southeasterly along said limit to Camrose Drive;
- thence southerly along said drive to Paradise Road; thence generally southeasterly along said road to Topsail Road;
- thence generally easterly along said road to the southeasterly limit of the Town of Paradise;
- thence southerly and westerly along said limit to the easterly limit of the Town of Conception Bay South;
- thence generally southerly and westerly along said limit to the southerly limit of the City of St. John's;
- thence generally southeasterly along said limit to the northwesternmost point of the Town of Bay Bulls;
- thence generally southerly along the westerly limit of said town to the northwesternmost point of the Town of Witless Bay;
- thence southerly and generally easterly along the westerly and southerly limits of said town to the easterly limit of said town.
- Including Iona Islands, East Green Island, North Green Island, Harbour Island, Fox Island, Great Colinet Island and all other islands adjacent to the shoreline of the above-described area.
Political geography
Avalon is divided between the Liberal north and the Conservative south. Conservative support is found along the southern coast from the community of Bay Bulls to Southern Harbour. The Conservatives also have some concentration in the north central peninsula, including winning the town of Harbour Grace. The Liberals dominate the central and northern parts of the riding. In 2008, the NDP won two polls, one was a mobile poll, and the other contained the community of Hopeall. The Greens also won a poll in Witless Bay.
History
The electoral district was created in 2003 from 57.6% of Bonavista—Trinity—Conception, 21.9% of St. John's West and 20.5% of St. John's East ridings. It consisted of:[5]
- that part of the Avalon Peninsula on the Island of Newfoundland described as follows:
- commencing at a point in Placentia Bay approximately 20 km west of Cape St. Mary's;
- thence generally northerly along Placentia Bay and the Eastern Channel of Placentia Bay to the intersection of the shoreline of Placentia Bay with the westerly limit of the Town of Come By Chance;
- thence northerly and easterly along the westerly and northerly limits of said town to the Trans-Canada Highway (Route No. 1);
- thence northerly along said highway to the northerly limit of the Town of Sunnyside;
- thence easterly along said limit and its production into Trinity Bay;
- thence northerly along said bay to a point midway between East Random Head on Random Island and Hant's Head on the eastern shoreline of Trinity Bay;
- thence northeasterly along said bay to a point approximately 5 km north of Grates Point on the Bay de Verde Peninsula;
- thence easterly approximately 20 km to a point N45°E of Baccalieu Island;
- thence generally southerly along Conception Bay to a point midway between Western Bay Head on the western shoreline of Conception Bay and Cape St. Francis;
- thence southerly along Conception Bay to a point approximately 2 km west of the most westerly extremity of Bell Island;
- thence southerly along Conception Bay to a point approximately 2 km S45°W of the most southwesterly extremity of Kellys Island;
- thence easterly along Conception Bay to the mouth of Long Pond Harbour;
- thence southerly along said harbour and Conway Brook to the limit of the City of St. John's;
- thence generally southwesterly and easterly along the northwesterly and southerly limits of said city and its production to the Atlantic Ocean;
- thence generally southerly and generally westerly along the Atlantic Ocean, Trepassey Bay, St. Mary's Bay and Placentia Bay to the point of commencement.
- Including Baccalieu Island, Great Colinet Island and all other islands adjacent to the shoreline of the above-described area.
The 2012 federal electoral boundaries redistribution concluded that the electoral boundaries of Avalon should be adjusted, and a modified electoral district of the same name will be contested in future elections.[6] The redefined Avalon had its boundaries legally defined in the 2013 representation order which came into effect upon the call of the 42nd Canadian federal election, scheduled for October 2015.[7] 21% of this riding will be moved into Bonavista—Burin—Trinity, and 3% will be moved into St. John's South—Mount Pearl, and will gain 25% of its new territory from St. John's East. It was given the boundaries described above.
Members of Parliament
This riding has elected the following Members of Parliament:
| Parliament | Years | Member | Party | |
|---|---|---|---|---|
| Avalon Riding created from Bonavista—Trinity—Conception, St. John's East and St. John's West |
||||
| 38th | 2004–2006 | John Efford | Liberal | |
| 39th | 2006–2008 | Fabian Manning | Conservative | |
| 40th | 2008–2011 | Scott Andrews | Liberal | |
| 41st | 2011–2014 | |||
| 2014–2015 | Independent | |||
| 42nd | 2015–2019 | Ken McDonald | Liberal | |
| 43rd | 2019–2021 | |||
| 44th | 2021–present | |||
Election results
2021 general election
| 2021 Canadian federal election | ||||||||
|---|---|---|---|---|---|---|---|---|
| Party | Candidate | Votes | % | ±% | Expenditures | |||
| Liberal | Ken McDonald | 18,608 | 50.10 | +3.84 | ||||
| Conservative | Matthew Chapman | 12,738 | 34.29 | +3.19 | ||||
| New Democratic | Carolyn Davis | 5,151 | 13.87 | −3.41 | ||||
| People's | Lainie Stewart | 647 | 1.74 | – | ||||
| Total valid votes | 37,144 | 99.27 | +0.21 | |||||
| Total rejected ballots | 273 | 0.73 | –0.22 | |||||
| Turnout | 37,417 | 53.31 | –7.06 | |||||
| Registered voters | 70,189 | |||||||
| Liberal hold | Swing | +0.33 | ||||||
| Source: Elections Canada[8] | ||||||||
2019 general election
| 2019 Canadian federal election | ||||||||
|---|---|---|---|---|---|---|---|---|
| Party | Candidate | Votes | % | ±% | Expenditures | |||
| Liberal | Ken McDonald | 19,122 | 46.26 | −9.64 | $63,518.25 | |||
| Conservative | Matthew Chapman | 12,855 | 31.10 | +20.00 | $37,082.47 | |||
| New Democratic | Lea Mary Movelle | 7,142 | 17.28 | +2.85 | none listed | |||
| Green | Greg Malone | 2,215 | 5.36 | +4.82 | none listed | |||
| Total valid votes/expense limit | 41,334 | 99.05 | -0.57 | $104,436.05 | ||||
| Total rejected ballots | 397 | 0.95 | +0.57 | |||||
| Turnout | 41,731 | 59.33 | −2.36 | |||||
| Eligible voters | 70,341 | |||||||
| Liberal hold | Swing | −14.82 | ||||||
| Source: Elections Canada[9][10] | ||||||||
2015 general election
| 2015 Canadian federal election | ||||||||
|---|---|---|---|---|---|---|---|---|
| Party | Candidate | Votes | % | ±% | Expenditures | |||
| Liberal | Ken McDonald | 23,528 | 55.90 | +22.73 | $70,924.68 | |||
| Independent | Scott Andrews | 7,501 | 17.82 | –26.15 | $63,334.50 | |||
| New Democratic | Jeannie Baldwin | 6,075 | 14.43 | –14.10 | $70,840.75 | |||
| Conservative | Lorraine E. Barnett | 4,670 | 11.10 | –26.00 | $58,123.54 | |||
| Green | Krista Byrne-Puumala | 228 | 0.54 | –0.09 | $76.49 | |||
| Strength in Democracy | Jennifer McCreath | 84 | 0.20 | – | – | |||
| Total valid votes/expense limit | 42,086 | 100.00 | $208,407.32 | |||||
| Total rejected ballots | 162 | 0.38 | ||||||
| Turnout | 42,248 | 62.33 | ||||||
| Eligible voters | 67,781 | |||||||
| Liberal notional gain from Conservative | Swing | +24.36 | ||||||
| Source: Elections Canada[11][12] | ||||||||
| 2011 federal election redistributed results[13] | |||
|---|---|---|---|
| Party | Vote | % | |
| Conservative | 13,214 | 37.09 | |
| Liberal | 11,820 | 33.18 | |
| New Democratic | 10,164 | 28.53 | |
| Green | 226 | 0.63 | |
| Others | 201 | 0.56 | |
2011 general election
In the 2011 election, the Liberal candidate was the incumbent MP, Scott Andrews, a former municipal councillor from Conception Bay South. He defeated the Tory candidate, Senator Fabian Manning of St. Bride's, for the second election in a row. Manning was the Conservative MP for this riding from 2006 to 2008, when he lost to Andrews.
| 2011 Canadian federal election | ||||||||
|---|---|---|---|---|---|---|---|---|
| Party | Candidate | Votes | % | ±% | Expenditures | |||
| Liberal | Scott Andrews | 16,008 | 43.97 | -1.31 | $71,517.62 | |||
| Conservative | Fabian Manning | 14,749 | 40.51 | +5.35 | $85,098.25 | |||
| New Democratic | Matthew Martin Fuchs | 5,157 | 14.16 | -3.22 | $3,735.98 | |||
| Independent | Randy Wayne Dawe | 276 | 0.76 | – | $1,060.00 | |||
| Green | Matt Crowder | 218 | 0.60 | -1.57 | $11.96 | |||
| Total valid votes/expense limit | 36,408 | 100.0 | – | $85,411.40 | ||||
| Total rejected, declined and unmarked ballots | 166 | 0.45 | -0.34 | |||||
| Turnout | 36,574 | 56.77 | +4.97 | |||||
| Eligible voters | 64,424 | |||||||
| Liberal hold | Swing | -3.33 | ||||||
| Sources:[14][15] | ||||||||
2008 general election
| 2008 Canadian federal election | ||||||||
|---|---|---|---|---|---|---|---|---|
| Party | Candidate | Votes | % | ±% | Expenditures | |||
| Liberal | Scott Andrews | 14,866 | 45.28 | +6.70 | $68,253 | |||
| Conservative | Fabian Manning | 11,542 | 35.16 | -16.39 | $54,159 | |||
| New Democratic | Randy Wayne Dawe | 5,707 | 17.38 | +8.31 | $25,080 | |||
| Green | Dave Aylward | 714 | 2.17 | +1.37 | $766 | |||
| Total valid votes/expense limit | 32,829 | 100.0 | – | $82,453 | ||||
| Total rejected, declined and unmarked ballots | 262 | 0.79 | -0.86 | |||||
| Turnout | 33,091 | 51.80 | -7.81 | |||||
| Eligible voters | 63,882 | |||||||
| Liberal gain from Conservative | Swing | +11.54 | ||||||
2006 general election
| 2006 Canadian federal election | ||||||||
|---|---|---|---|---|---|---|---|---|
| Party | Candidate | Votes | % | ±% | Expenditures | |||
| Conservative | Fabian Manning | 19,132 | 51.55 | +22.24 | $71,141 | |||
| Liberal | Bill Morrow | 14,318 | 38.58 | -19.76 | $71,528 | |||
| New Democratic | Eugene Conway | 3,365 | 9.07 | -1.91 | $1,036 | |||
| Green | Shannon Hillier | 297 | 0.80 | -0.57 | none listed | |||
| Total valid votes/expense limit | 37,112 | 100.0 | – | $76,596 | ||||
| Total rejected, declined and unmarked ballots | 623 | 1.65 | +0.59 | |||||
| Turnout | 37,735 | 59.61 | +9.78 | |||||
| Eligible voters | 63,303 | |||||||
| Conservative gain from Liberal | Swing | +21.00 | ||||||
2004 general election
| 2004 Canadian federal election | ||||||||
|---|---|---|---|---|---|---|---|---|
| Party | Candidate | Votes | % | ±% | Expenditures | |||
| Liberal | R. John Efford | 18,335 | 58.34 | +12.41 | $47,245 | |||
| Conservative | Rick Dalton | 9,211 | 29.31 | -10.37 | $50,104 | |||
| New Democratic | Michael Kehoe | 3,450 | 10.98 | -3.24 | $2,472 | |||
| Green | Don C. Ferguson | 430 | 1.37 | – | $746 | |||
| Total valid votes/expense limit | 31,246 | 100.0 | – | $74,947 | ||||
| Total rejected, declined and unmarked ballots | 336 | 1.06 | ||||||
| Turnout | 31,762 | 49.83 | ||||||
| Eligible voters | 63,745 | |||||||
| Liberal notional hold | Swing | +11.39 | ||||||
| Changes from 2000 are based on redistributed results. Change for the Conservatives is from the combined totals of the Progressive Conservatives and the Canadian Alliance. | ||||||||
| 2000 federal election redistributed results | |||
|---|---|---|---|
| Party | Vote | % | |
| Liberal | 17,614 | 45.93 | |
| Progressive Conservative | 14,412 | 37.58 | |
| New Democratic | 5,454 | 14.22 | |
| Alliance | 805 | 2.10 | |
| Others | 66 | 0.17 | |
Student Vote Results
2019
| 2019 Canadian federal election | ||||||||
|---|---|---|---|---|---|---|---|---|
| Party | Candidate | Votes | % | ±% | ||||
| Liberal | Kenneth McDonald | 1,332 | 30.35 | -24.69 | ||||
| New Democratic | Lea Mary Movelle | 1,292 | 29.44 | +14.74 | ||||
| Conservative | Matthew Chapman | 1,045 | 23.81 | +17.03 | ||||
| Green | Greg Malone | 720 | 16.4 | +12.4 | ||||
| Total Valid Votes | 4,389 | 100.0 | – | |||||
| Source: Student Vote Canada[16] | ||||||||
2015
| 2015 Canadian federal election | ||||||||
|---|---|---|---|---|---|---|---|---|
| Party | Candidate | Votes | % | ±% | ||||
| Liberal | Ken McDonald | 633 | 55.04 | +6.32 | ||||
| Independent | Scott Andrews | 212 | 18.43 | -30.29 | ||||
| New Democratic | Jeannie Baldwin | 169 | 14.7 | +3.33 | ||||
| Conservative | Lorraine E. Barnett | 78 | 6.78 | -22.74 | ||||
| Green | Krista Byrne-Puumala | 46 | 4 | -3.86 | ||||
| Strength in Democracy | Jennifer McCreath | 12 | 1.04 | – | ||||
| Total Valid Votes | 1,150 | 100.0 | – | |||||
| Source: Student Vote Canada[17] | ||||||||
2011
| 2011 Canadian federal election | ||||||||
|---|---|---|---|---|---|---|---|---|
| Party | Candidate | Votes | % | |||||
| Liberal | Scott Andrews | 972 | 48.72 | |||||
| Conservative | Fabian Manning | 589 | 29.52 | |||||
| New Democratic | Matthew Martin Fuchs | 227 | 11.37 | |||||
| Green | Matt Crowder | 157 | 7.86 | |||||
| Independent | Randy Wayne Dawe | 50 | 2.5 | |||||
| Total Valid Votes | 1,995 | 100.0 | ||||||
| Source: Student Vote Canada[18] | ||||||||
See also
- List of Canadian federal electoral districts
- Past Canadian electoral districts
References
- "(Code 10001) Census Profile". 2011 census. Statistics Canada. 2012. Retrieved March 3, 2011.
Notes
- Statistics Canada: 2017
- Statistics Canada: 2017
- "NHS Profile, Avalon, Newfoundland and Labrador, 2011". Statistics Canada. Retrieved October 22, 2019.
- Avalon – Maps Corner – Elections Canada Online
- Riding History for Avalon (2003– )
- Report – Newfoundland and Labrador
- Timeline for the Redistribution of Federal Electoral Districts
- "Election Night Results — Elections Canada". Elections Canada. September 25, 2021. Retrieved September 25, 2021.
{{cite web}}: CS1 maint: url-status (link) - "Results Validated by the Returning Officer". Elections Canada. Retrieved October 24, 2019.
- "Final Election Expense Limits for Candidates: 43rd General Election - October 21, 2019". Elections Canada. Retrieved December 2, 2019.
- "October 19, 2015 Election Results — Avalon (Validated results)". Elections Canada. October 21, 2015. Archived from the original on October 26, 2015. Retrieved October 24, 2015.
{{cite web}}: CS1 maint: unfit URL (link) - Elections Canada – Preliminary Election Expenses Limits for Candidates Archived 2015-08-15 at the Wayback Machine
- Pundits' Guide to Canadian Elections
- Elections Canada – Official voting results, Forty-first general election, 2011
- Elections Canada – Candidate's electoral campaign return, 41st general election
- "Student Vote Canada 2019". Retrieved September 21, 2020.
- "Student Vote". Retrieved September 20, 2020.
- "District Results". Student Vote. Archived from the original on May 6, 2015. Retrieved September 20, 2020.
External links
- Avalon riding from Elections Canada
- Riding history for Avalon (2003– ) from the Library of Parliament
- Election Financial Reports from Elections Canada
- Avalon District Profile from Statistics Canada
- Census subdivisions of Newfoundland and Labrador from Statistics Canada
Другой контент может иметь иную лицензию. Перед использованием материалов сайта WikiSort.org внимательно изучите правила лицензирования конкретных элементов наполнения сайта.
WikiSort.org - проект по пересортировке и дополнению контента Википедии